
The S&P 500 could be approaching another significant correction after flashing a bearish technical signal that has preceded major market pullbacks twice since the 2020 COVID-19 crash.
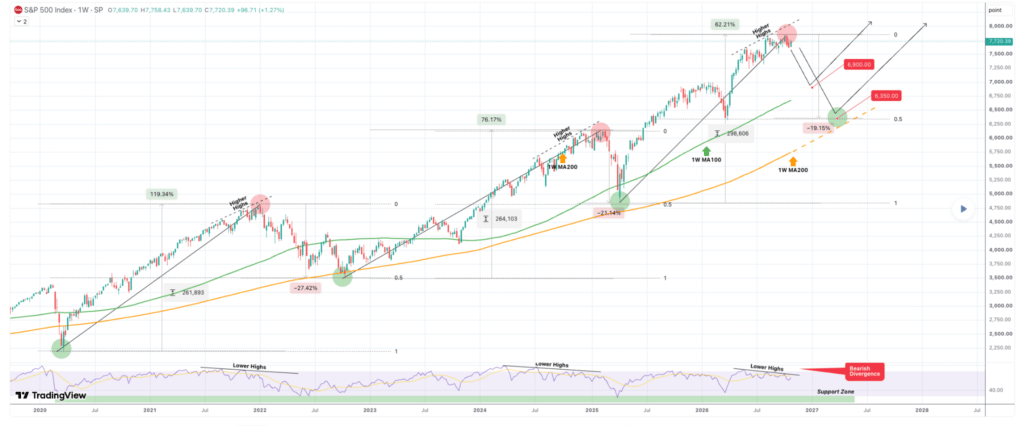
An analysis of the benchmark index’s weekly chart by TradingShot, published in a TradingView post on October 30, points to a recurring pattern involving bearish divergence on the Relative Strength Index (RSI), followed by a correction toward its 200-week moving average (MA) and the 0.5 Fibonacci retracement level.
The pattern has emerged again, raising the possibility that the S&P 500 could retreat from its latest highs before resuming its longer-term uptrend.
Advertisement
According to the analysis, the index has been forming lower highs on its weekly RSI since May 26, 2026, suggesting that bullish momentum is weakening even as prices continue to advance.
Historical resemblance
The latest setup mirrors two previous market cycles. In both instances, the S&P 500 recorded bearish divergence on its weekly RSI before reversing from a market peak and entering a substantial correction.
The first cycle followed the March 2020 pandemic crash. The index subsequently rallied 119.34% before declining 27.42% toward its 200-week moving average and the 0.5 Fibonacci retracement level.
A similar pattern emerged during the next cycle, with the S&P 500 advancing 76.17% before correcting 21.14% in 2025. Both declines brought the index toward its longer-term technical support levels.
The current cycle has produced a 62.21% advance from its previous bottom, compared with the larger gains recorded during the preceding two bull cycles.
The analysis also measured the latest advance at approximately 298,606 points, exceeding the corresponding 264,103-point and 261,893-point advances in the previous cycles.
Advertisement
Rally losing momentum
This suggests that the rally could be losing momentum, particularly as the weekly RSI continues to register lower highs despite the index reaching higher price levels.
If the historical pattern repeats, the S&P 500 could experience another substantial correction, with the 0.5 Fibonacci retracement level around 6,350 emerging as a potential downside target.
The analysis estimates that such a decline would amount to a 19.15% correction based on its underlying reference level.
A less severe pullback could see the index find support around 6,900, close to its 100-week moving average. This would represent a more moderate correction and could allow the broader bullish trend to remain intact.
The distinction is important because the previous corrections coincided with significant market catalysts. The 2022 sell-off unfolded amid an inflation crisis and aggressive monetary tightening, while the 2025 correction was associated with escalating U.S.-China trade tensions.
Without a similarly powerful catalyst, the analysis considers a decline toward the 100-week moving average more likely than a full retracement to 6,350.
Advertisement
Wall Street flags growing S&P 500 risks
The technical warning comes as other market indicators point to weakening conditions beneath the S&P 500’s headline performance.
Although analysts expected earnings growth of 30.6%, much of the projected increase was concentrated among the Magnificent Seven technology companies. Earnings growth for the remaining constituents was projected at just 5%.
Market breadth has also deteriorated, with 62% of S&P 500 constituents trading below their 50-day moving averages, suggesting that the index’s resilience was masking weakness across a substantial portion of the market.
Other concerns include rising Treasury yields, uncertainty surrounding the U.S. midterm elections, and questions about the sustainability of AI-related investment.
Morgan Stanley strategists have also warned of a potential near-term correction of up to 8%, with a possible decline toward 7,100 before a subsequent recovery toward 8,000.
Featured image via Shutterstock