Finance & crypto platform
Finbold delivers the latest crypto and finance news, comprehensive guides and state-of-the-art features to empower your informed financial decision-making.
Insider Trading
Get companies’ trading activity
Price Alerts
Set up stocks & crypto price alerts
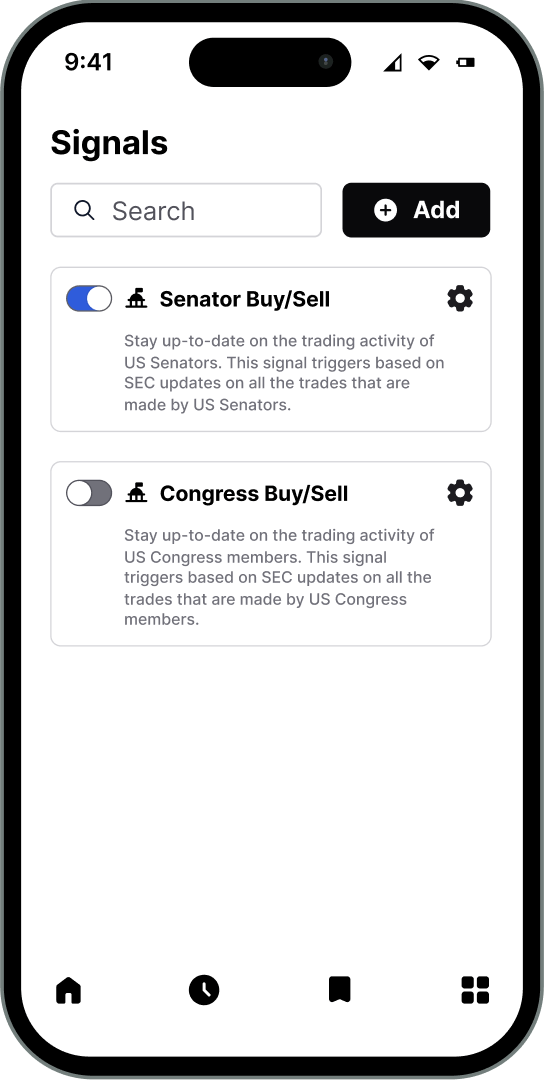
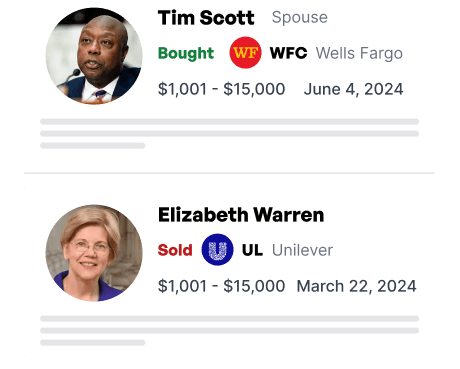
Trading Signals
Track US politician stock trades
Watchlist
Monitor relevant stocks & crypto
Stock News
Latest stock market news
Crypto News
Actionable cryptocurrency news
AI Price Prediction News
Analysis of latest AI predictions
ML Price Prediction News
Machine-learning price analysis
Latest news


Features
Receive stock trading activity of US Senators and Members of Congress with disclosed trade amounts, transaction dates, and price change since. Learn more about US politician trading signals.
Free
- 3 alerts
- 3 watched assets
- 1 signal /month
Finbold+
- 25 alerts
- 25 watched assets
- 25 signals /month
Crypto news


Press Releases
24 mins ago
Cardano’s Momentum Cools55 mins ago
The Fall of Shiba Inu and DogecoinStock news


Stocks


Sponsored
Finance Digest
Uphold is the easiest way to buy and sell cryptocurrency.
Unlike any other platform, we allow you to trade in just one step between any supported asset.
IMPORTANT NOTICE
Finbold is a news and information website. This Site may contain sponsored content, advertisements, and third-party materials, for which Finbold expressly disclaims any liability.
RISK WARNING: Cryptocurrencies are high-risk investments and you should not expect to be protected if something goes wrong. Don’t invest unless you’re prepared to lose all the money you invest. (Click here to learn more about cryptocurrency risks.)
By accessing this Site, you acknowledge that you understand these risks and that Finbold bears no responsibility for any losses, damages, or consequences resulting from your use of the Site or reliance on its content. Click here to learn more.