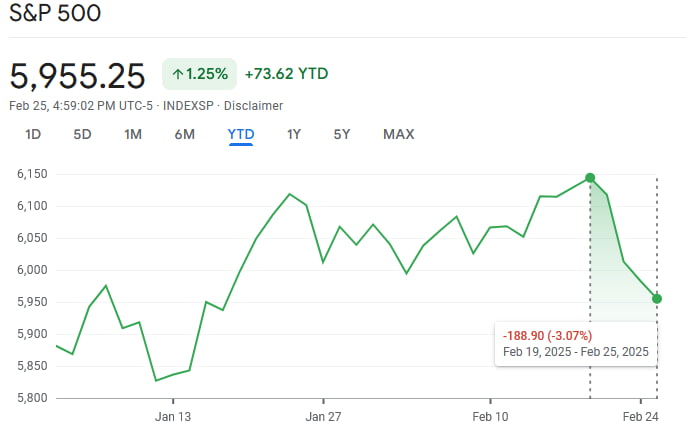
The benchmark Standard and Poor’s 500 (S&P 500) index rose by approximately 25% over the course of 2024. By the close of the year, even the most bullish estimates from Wall Street conceded that 2025 would most likely not end up being the banner year that its predecessor was.
The Street high estimate, set by Oppenheimer strategist John Stoltzfus, implied a 17.54% rise in the index. Despite these optimistic forecasts, by press time on February 26, the S&P 500 had receded to 5,995.25, after a 3% drop from an all-time high (ATH) of 6,114 on February 19.
It is not particularly hard to make the case for caution and uncertainty. Whether taking into account the Buffett indicator or crucial metrics like trailing or forward price to earnings (P/E) and CAPE, all signs seem to point to the fact that, at present, the stock market is historically overvalued.
This isn’t a particularly new development, either — which raises additional concerns as to whether or not the current rally is sustainable. However, one technical analyst has recently put forward a bullish short-term analysis, outlining why a roughly 6% surge for the index might be in the cards.
Key technical indicators point that the S&P 500 could rally to levels above 6,300
The S&P 500 has been in a channel-up chart pattern since an August 2024 low. Every time that the index dipped below its 200-period moving average (MA) on the 4-hour timeframe, a technical buy opportunity occurred, per renowned chart expert TradingShot.
In previous instances where this happened, the S&P 500 rose by either 6.22% or slightly above 7%. The chart’s author also noted that this latest structure closely resembles the first upward price move in the channel — accordingly, they have set a target at 6,330, which implies a 6.2% rally.
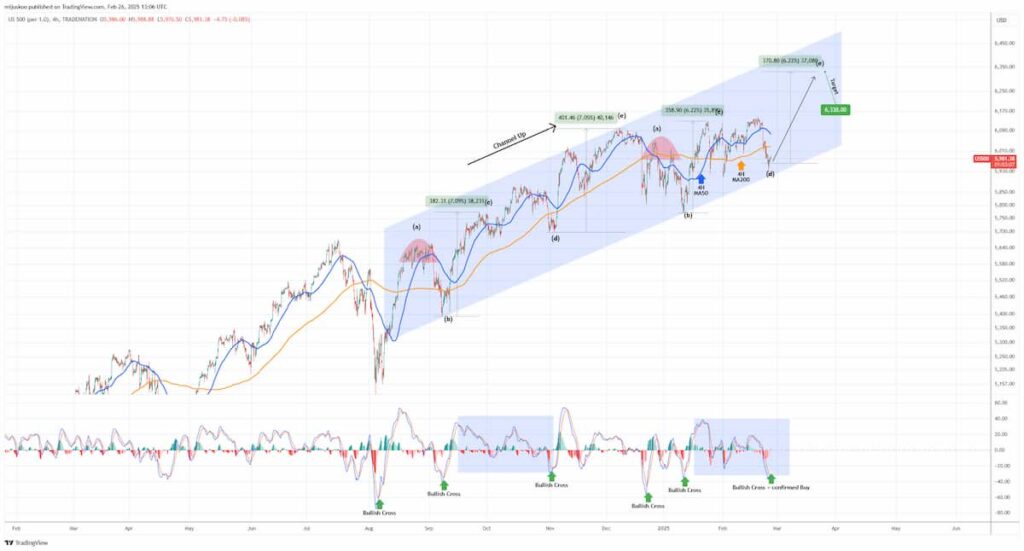
Although TradingShot did not specify an expected timeframe for this surge, a closer look at the chart in question reveals that in previous instances, the rise in the index occurred over a period of 2 to 3 weeks.
As covered by Finbold, the analyst had previously predicted that the rally could extend even further, up to 6,600 — yet on a longer timeframe.
Featured image via Shutterstock