
Bitcoin (BTC) investors should anticipate a further drop in the asset based on notable technical indicators exhibited by the cryptocurrency.
According to crypto trading expert Alan Santana, in a TradingView post on August 29, investors can identify potential trend reversals in the Bitcoin market by leveraging the exponential moving averages (EMAs) and trading volume.
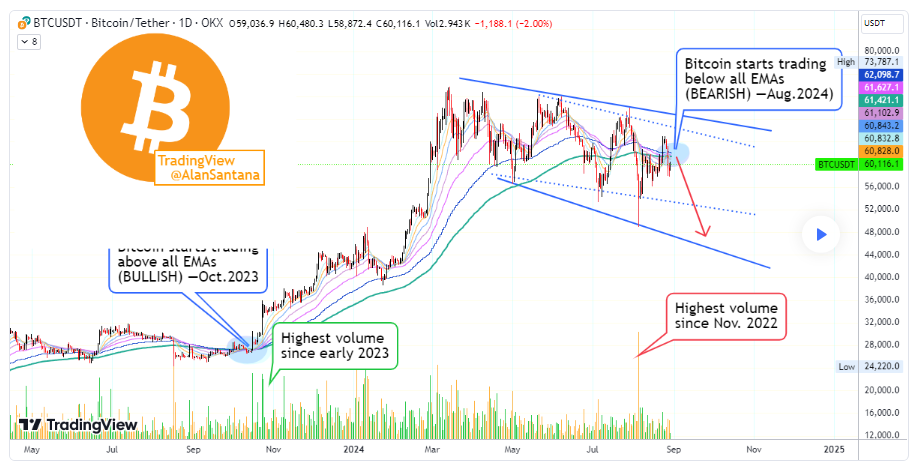
In October 2023, Bitcoin traded sideways, consolidating below several critical EMAs. However, a decisive move above these averages triggered a bullish trend, supported by the highest trading volume seen in many months. This breakout began a sustained upward price movement, confirming the market’s bullish sentiment.
The analyst noted that in August 2024, Bitcoin was in a similar yet opposite situation. The bearish sentiment strengthened as Bitcoin began trading below all the key EMAs this time. This shift was accompanied by the highest bearish volume since November 2022, signaling that a significant price drop might be on the horizon.
Bitcoin key levels to watch
Santana noted that just as the high-volume move above the EMAs confirmed the bullish trend in 2023, the current high-volume move below the EMAs likely confirms a bearish trend. The EMAs in question range from 8 to 144 periods, with the highest being around $62,100 and the lowest around $60,800.
The analysis pointed to a potential slight bounce to the $62,000 range, which could set a new lower high before Bitcoin begins its next leg down. The next major low target is around $48,000, a level that could be reached as part of the expected price drop, following the formation of a lower high of around $65,000.
“This month, August 2024, as Bitcoin moved and closed below all the EMAs, it also produced the highest bearish volume since November 2022. This can signal can easily precede a major price drop,” the expert said.
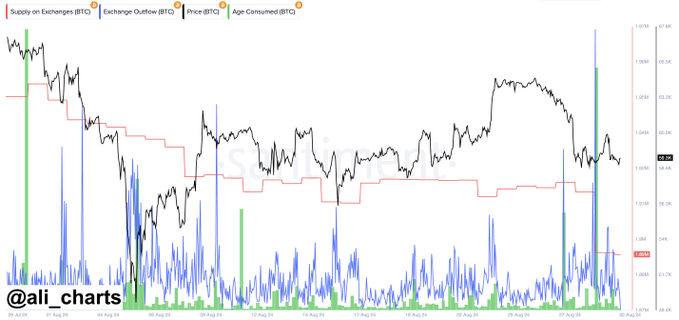
It’s worth noting that Bitcoin continues to exhibit bearish sentiments, with whales seemingly taking advantage. According to data from crypto analysis platform Santiment, shared by Ali Martinez, there was a 40,000 BTC drop in exchange supply over the past 48 hours, equivalent to about $2.40 billion. This suggests that whales might accumulate the asset in anticipation of a possible breakout.

Bitcoin price potential breakout
Regarding a potential price breakout, crypto analyst Michaël van de Poppe noted that Bitcoin is hovering between crucial levels, signaling an uncertain yet pivotal moment for the cryptocurrency market.
He pointed out that market analysts are closely watching the Personal Consumption Expenditures (PCE) data release, anticipating potential bullish movement. The PCE data, a key indicator of inflation, has historically influenced market sentiment across various asset classes, including cryptocurrencies. Notably, the data remained unchanged at 2.5% on a yearly basis in July, below the market expectation of 2.6%.
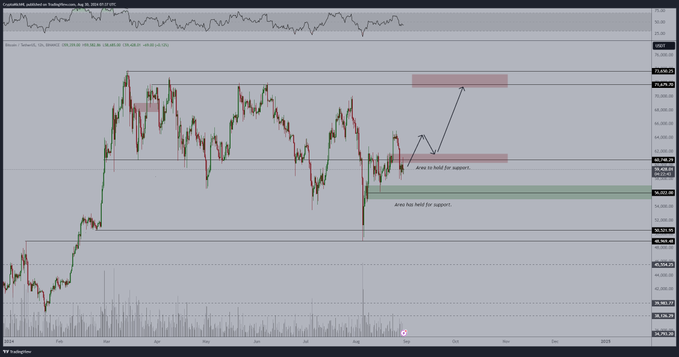
According to van de Poppe, Bitcoin is trading in a range with strong support around the $54,200 level, a zone that has held firm during recent market downturns.
The resistance to watch, however, is at $61,000. This level is seen as a critical threshold; breaking above it could pave the way for Bitcoin to test higher levels and potentially set a new upward trajectory. Conversely, failure to break this resistance could cause Bitcoin to remain in its current range.
Bitcoin price analysis
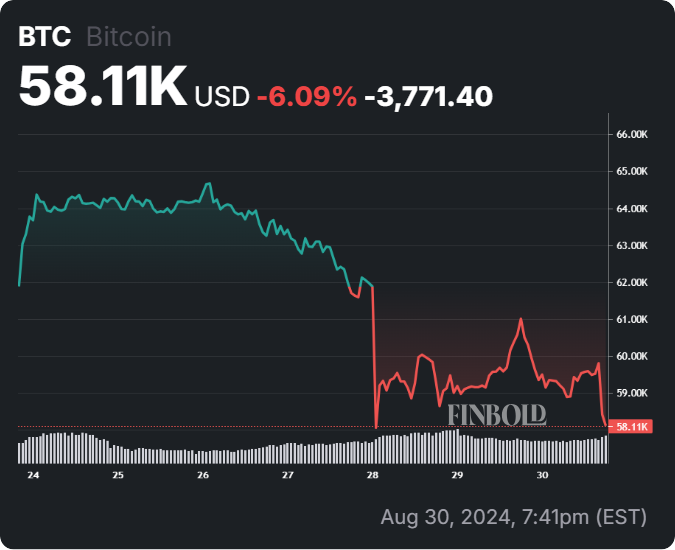
At the time of reporting, Bitcoin was valued at $58,110, with the digital asset failing to reclaim the $60,000 resistance in the short term. The current price level indicates that Bitcoin has plunged over 3% in the last 24 hours, while BTC is down almost 7% over the past seven days.
In conclusion, Bitcoin appears to be in limbo at the moment, with bulls and bears waiting for each other to make any significant move. Based on recent trading activity, the $60,000 level remains central to Bitcoin’s ability to validate any bullish trajectory.
Disclaimer: The content on this site should not be considered investment advice. Investing is speculative. When investing, your capital is at risk.