Despite meeting analysts’ expectations in its recent earnings report, Alphabet (NASDAQ: GOOGL) stock experienced a notable sell-off.
This downturn was primarily driven by CEO Sundar Pichai’s comments on the prolonged timeline for artificial intelligence (AI) to yield significant returns. According to sources, Pichai emphasized the need for continued efforts to unlock AI value, which led to profit-taking among traders in the tech sector.
In Q2 2024, Alphabet posted strong results in search advertising and cloud computing, with revenues exceeding expectations.
However, YouTube ad revenue fell short of estimates, and the company signaled higher expenses in the upcoming quarter, potentially curtailing margin growth. The rise in operating costs is attributed to increased capital spending on AI and new hardware launches.
Despite these short-term challenges, analysts remain optimistic about Alphabet’s long-term prospects.
Technical analysis and future projections
Technical analysis signals a bullish trend for GOOG stock. An analysis shared by TradingShot on TradingView on July 25 highlights that GOOG has been demonstrating a strong bullish trend over the past several months, consistently moving within an upward channel.
The stock recently broke below the one-day moving average (1D MA50) at around $141, which had been serving as a significant support level since March 15, 2023. Additionally, the price correction nearly touched the one-day moving average 100 (1D MA100) at approximately $135, which has consistently held as a support since mid-March.
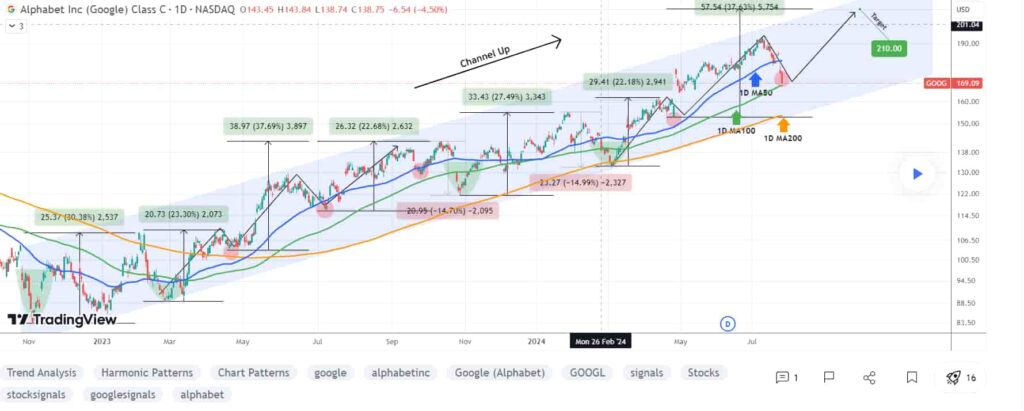
This recent price correction aligns with previous mid-bullish leg pull-backs. Historically, such pull-backs have been followed by significant upward movements.
For instance, after the pull-back on July 11, 2023, the stock experienced a 37.69% rise. Analysts are now targeting a 37.69% rise from the recent low on April 25, which would place the stock price at approximately $210.
Historical patterns and support levels
The analysis of past price movements shows that GOOG has a pattern of strong recoveries following corrections.
The recent dip to the 1D MA100 suggests a similar opportunity for growth. Based on the previous performance, where the stock surged 37.69% after hitting a higher low, analysts predict a similar rise is imminent.
This potential rise is supported by several factors. The 1D MA100 at around $135 has proven to be a reliable support level, reinforcing the bullish trend. Additionally, the stock continues to move within an upward channel, suggesting sustained bullish momentum.
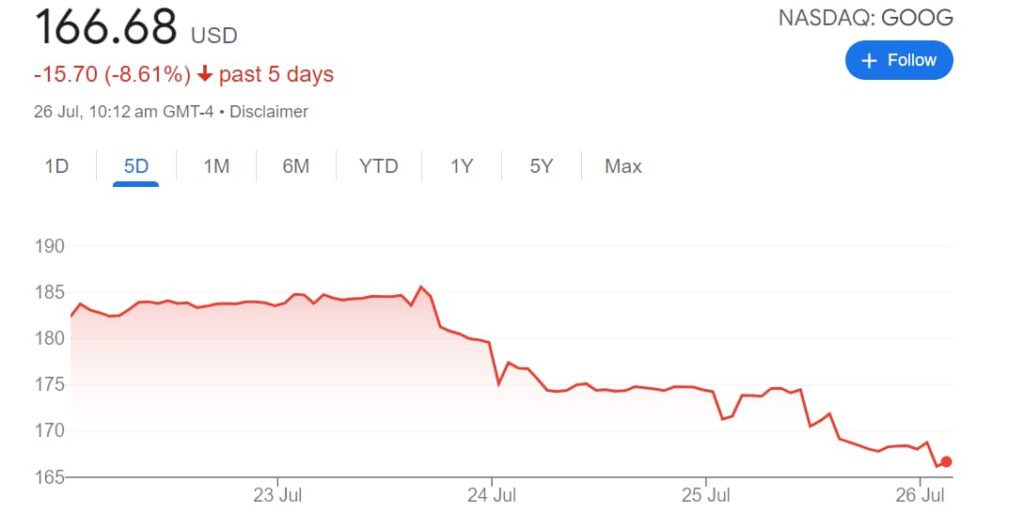
However, it’s important to note that GOOGL has significantly slowed down its rise in the last week, dipping over 9% to the price of $166.68 at the press time.
In conclusion, the combination of historical performance, current technical indicators, and the stock’s adherence to the upward channel strongly suggests that GOOG is positioned for a significant rise.
Investors looking for a buying opportunity may find this current correction to be an optimal entry point. The consistent support from the 1D MA100 and the overall bullish trend show the potential for substantial gains in the near future.
Disclaimer: The content on this site should not be considered investment advice. Investing is speculative. When investing, your capital is at risk.