
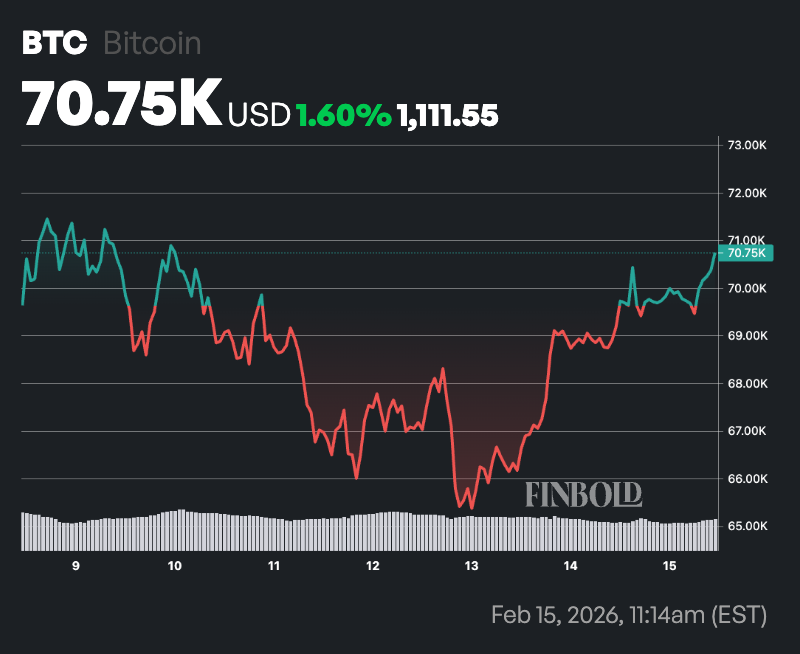
Although Bitcoin (BTC) has staged a minor recovery, reclaiming the $70,000 level, a trading expert has suggested the asset still has room to drop into what they identified as its “sweet spot.”
In this regard, insights from analyst TradingShot note that this area could serve as a key accumulation zone for Bitcoin as the asset posts its fourth consecutive weekly decline following a recent near test of the 200-week moving average.
In a TradingView post on February 12, the analyst observed that Bitcoin approached the 200-week MA at around $56,000 before extending its pullback.
Historically, the 200-week moving average has marked key bear market turning points, and a decisive break below it could signal a deeper correction.
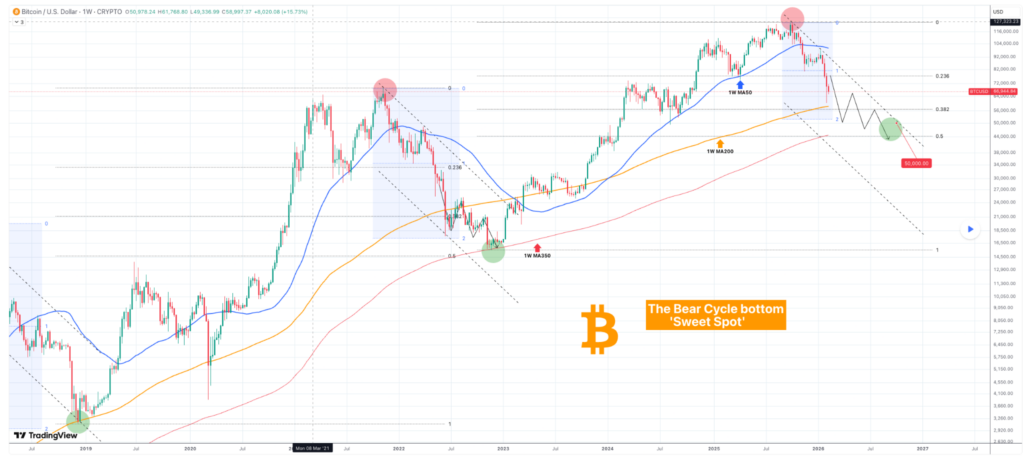
Last week’s low also neared the 0.382 Fibonacci retracement from the prior bear market bottom to the latest high. Similar past confluences between the 1-week MA200 and the 0.382 level have preceded extended bottoming phases. The area now also aligns with the 2.0 Fibonacci extension from the first leg of the 2022 bear cycle, reinforcing its technical significance.
Bitcoin key levels to watch
Based on this confluence, TradingShot pointed to the region between roughly $51,000 and $45,000 as the bear cycle “sweet spot.”
The upper boundary sits near the 2.0 extension around $51,000, while the lower boundary aligns with the 0.5 Fibonacci retracement near $45,000. From a cyclical perspective, this range represents a historically favorable area for long-term investors to begin rebuilding positions.
The analysis further outlined the 350-week MA as a deeper downside scenario that would mirror the structure of the 2022 bear market bottom, when price ultimately found support at the 350-week moving average before initiating a sustained recovery.
This outlook comes as Bitcoin posts a modest rebound, reclaiming the $70,000 level after a steep sell-off pushed the price near $60,000. The bounce was sparked by cooler-than-expected January U.S. CPI data (2.4% YoY versus 2.5% forecast), fueling hopes for earlier Federal Reserve rate cuts and reviving risk appetite across equities and crypto.
However, analysts view the move as a relief bounce amid deleveraging rather than strong new buying conviction.
Persistent institutional caution and prevailing cycle patterns suggest possible further downside tests before any sustained uptrend.
Bitcoin price analysis
At press time, Bitcoin was trading at $70,664, up more than 2% in the past 24 hours and 1.5% on the weekly chart.
As it stands, Bitcoin remains well below both its 50-day SMA ($84,961) and 200-day SMA ($100,963). This positioning signals a clear bearish trend in both the medium and long term. When price remains under these key moving averages, it typically reflects sustained selling pressure and weak bullish momentum.
The wide gap between the current price and the 200-day SMA further underscores the strength of the broader downtrend.
The 14-day RSI stands at 38.69, placing it in neutral territory but leaning toward the oversold threshold of 30. This suggests bearish momentum is present, though not yet extreme.
Featured image via Shutterstock