

Apple (NASDAQ: AAPL) could face a correction to $245 by late December 2026 if a historically reliable technical pattern plays out.
The forecast comes after Apple reached a new all-time high near $360 before showing signs of weakening momentum. A decline to $245 would represent a drop of roughly 32.2% from the July 2026 peak.
The analysis by TradingShot, published in a TradingView post on August 11, highlighted a recurring pattern on Apple’s weekly chart. Previous rallies that reached the upper boundary of a long-term ascending channel were followed by significant pullbacks toward key moving averages.
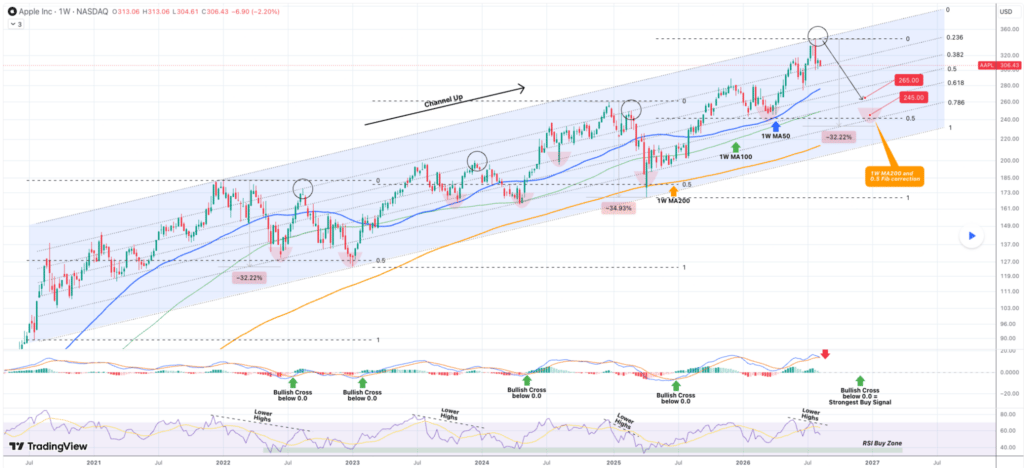
The analyst noted that the 0.236 Fibonacci channel zone has repeatedly triggered pullbacks toward the 50-week moving average, but current conditions point to a deeper correction.
AAPL’s technical play
A key concern is the weekly RSI, which is forming lower highs similar to patterns that preceded major tops in August 2022, December 2023, and early 2025. Each of those peaks was followed by a decline that reached at least the 100-week moving average.
Apple shares latest higher high also came after a pullback to the 50-week moving average earlier in 2026, creating a chart structure that closely mirrors previous market tops.
A move to the 100-week moving average near $265 is the most likely initial target before year-end, according to TradingShot. However, if Apple breaks below the 0.618 Fibonacci channel support, the correction could deepen toward the 200-week moving average around $245.
The $245 target aligns with both the 0.786 Fibonacci channel level and the 0.5 Fibonacci retracement, levels that were tested during the 2022 and 2025 pullbacks. It would also represent a 32.22% decline from the July all-time high, closely matching previous major corrections.
Adding to the bearish outlook, Apple’s weekly MACD has formed a bearish crossover, strengthening the sell signal and increasing the likelihood of further downside.
Still, TradingShot noted that Apple could become a medium-term buying opportunity once momentum indicators reset. A bullish MACD crossover below the zero line or an RSI move into its long-term buy zone would signal that the correction may be nearing its end.
Apple stock fundamentals
The technical warning comes despite strong business performance. Apple reported record fiscal third-quarter 2026 results, with revenue rising 16% year over year to $109.4 billion and profit increasing 27% to $29.8 billion. iPhone revenue jumped 22% to $54.3 billion, while Mac revenue climbed 29% to $10.4 billion.
However, investors focused on softer guidance for the current quarter. Apple projected revenue growth of 9% to 11%, below analyst expectations, citing supply constraints affecting advanced chips used in iPhones, Macs, and iPads.
The company is also undergoing a leadership transition, with Tim Cook set to become executive chairman on September 1 and hardware chief John Ternus taking over as chief executive officer.
At the same time, Apple continues to expand its artificial intelligence strategy through Apple Intelligence and an upgraded Siri platform while advancing plans for future iPhone models and a potential foldable device.
Featured image via Shutterstock