
A trading expert has warned that the S&P 500 could face a deeper correction after the index broke several key technical support levels, increasing the risk of further downside in the coming weeks.
The bearish outlook comes as the benchmark index continues to weaken amid a broader market sell-off. At the close of trading on Friday, the S&P 500 stood at 7,383, down 2.6% on the day.
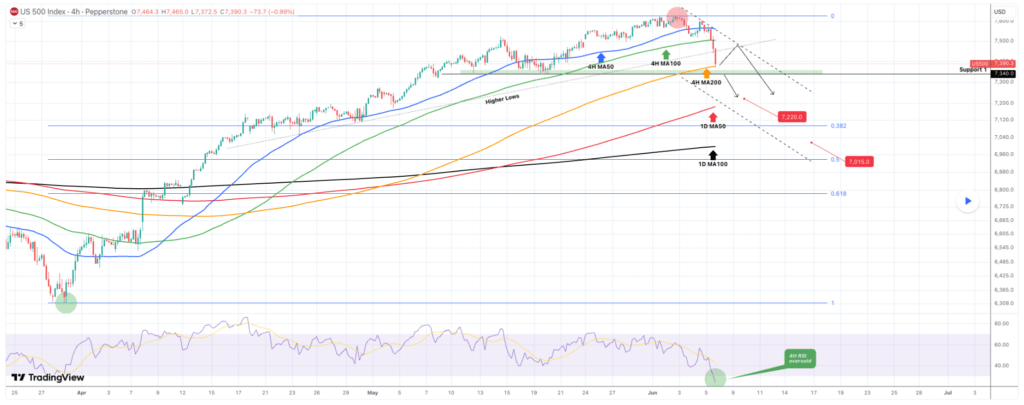
According to a TradingView analysis published by TradingShot on June 6, the bearish case stems from the S&P 500 breaking below both its 4-hour 100-period and 200-period moving averages in the same trading session.
The move marked the first breakdown of both medium-term trend indicators since early April, signaling a notable deterioration in market momentum.
The decline followed a rejection at the 4-hour 50-period moving average, which had shifted from support to resistance. That rejection accelerated selling pressure and pushed the index toward a key support zone around 7,340.
S&P 500’s key support zone
TradingShot noted that 7,340 is now the most important support level for the S&P 500. A decisive break below that area would confirm a stronger corrective phase and generate a bearish continuation signal. In that scenario, the next downside target would be the daily 50-period moving average near 7,220.
The analysis highlighted that the S&P 500 recently peaked above 7,600 before entering a sharp pullback. The decline has erased a significant portion of the latest advance and disrupted the series of higher lows that supported the rally throughout April and May.
Despite the bearish setup, the S&P 500 could see a short-term rebound after the four-hour Relative Strength Index (RSI) dropped below 30, entering oversold territory for the first time since the March 29 bottom. Such conditions often trigger relief rallies, with the index potentially retesting the 4-hour MA100 as resistance.
However, if selling pressure persists and the S&P 500 breaks below the 7,340 support level, the next downside target remains the daily MA50 near 7,220.
A further breakdown could push the index toward the daily MA100 at around 7,015, a level that has historically served as a major support zone during long-term bull markets.
Even a decline to 7,015 would leave the S&P 500 above the 50% Fibonacci retracement of the April-May rally, suggesting the broader uptrend would remain intact despite a deeper correction.
U.S. stock market correction
Indeed, the outlook comes after U.S. stocks suffered their sharpest sell-off of 2026 on June 6 after a stronger-than-expected jobs report dampened hopes for near-term Federal Reserve rate cuts.
The decline followed the release of May employment data showing 172,000 jobs were added, far exceeding forecasts of about 85,000. The unemployment rate held at 4.3%, reinforcing expectations that interest rates could remain elevated for longer.
Technology stocks led the losses, with Nvidia falling about 6%, Broadcom dropping nearly 8%, and Micron Technology tumbling more than 13%. The sell-off wiped roughly $1.8 trillion from the market value of S&P 500 companies.