Iconic lingerie retailer Victoria’s Secret (NYSE: VSCO) has experienced a rapid resurgence in its stock price over the past week. The catalyst behind this impressive rebound was primarily the company’s improved Q3 outlook, unveiled on October 12.
Furthermore, the stock received an extra boost when it revealed a shift away from its prior strategy emphasizing wokeness and inclusivity due to their poor impact on sales.
As a result, Victoria’s Secret saw a remarkable surge of more than 20% in the past seven days, and according to popular analyst and trader Nebraskangooner, VSCO is well-positioned to continue its upward trajectory.
VSCO’s uptrend looking ‘decent for continuation’
In his analysis posted on October 19, the analyst pointed out a significant trend in the VSCO chart. According to his observation, the stock price is displaying a bullish divergence in its on-balance volume (OBV) indicator.
“This chart looks decent for continuation. Monthly [chart] working on a nice bullish candle so far.”
– Nebraskangooner wrote in his post.
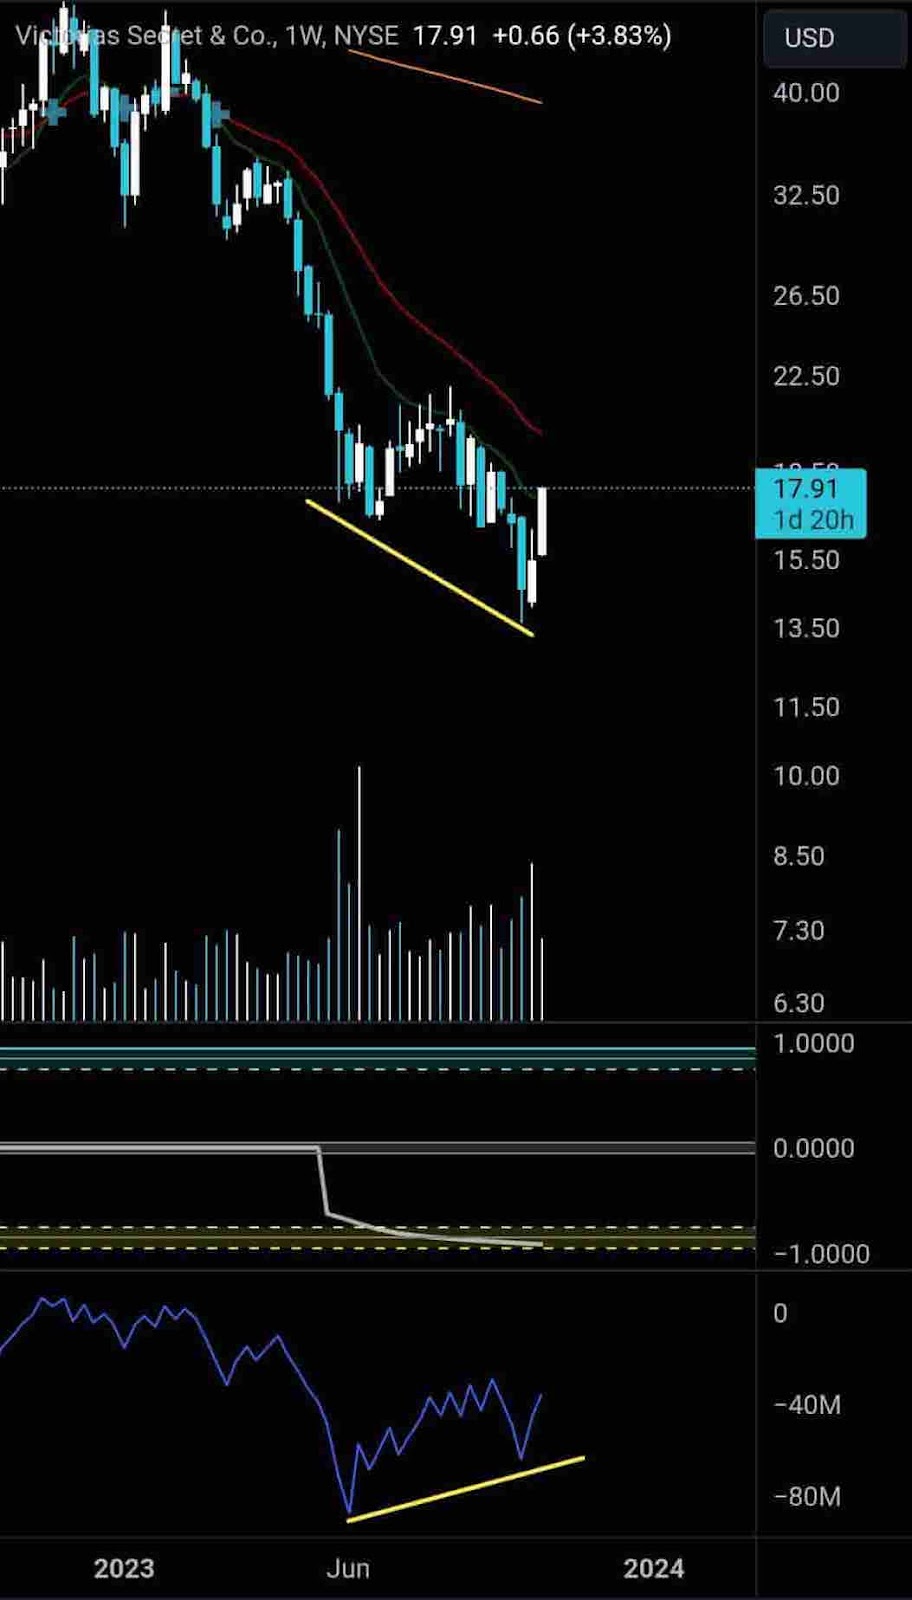
The OBV indicator is a technical analysis tool that assesses buying and selling pressure in a stock. It calculates a cumulative total based on the volume of trades, with positive volume added when the stock closes higher and negative volume subtracted when it closes lower.
A rising OBV (blue line in the lower part of the chart) typically indicates strong buying interest and suggests that a stock’s price may rise, while a falling OBV implies the opposite, indicating potential price declines.
VSCO stock price analysis
At the time of writing on October 20, shares of Victoria’s Secret were standing at $18, up 0.5% in the past 24 hours.

The retailer’s stock surged nearly 19% in the past week, adding about $200 million to its market cap during this period, according to TradingView data.
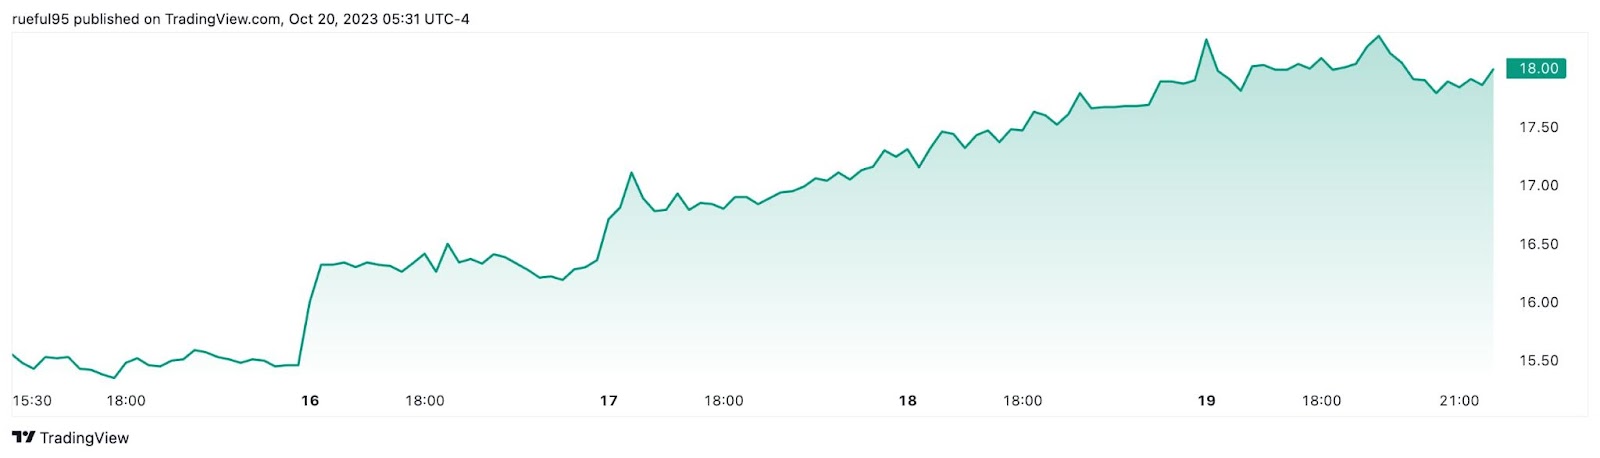
Year-to-date, however, the stock is still sharply down by more than 50% due to dismal quarterly earnings reports and a challenging macroeconomic environment.
If the bullish indications of the OBV tool are correct, VSCO may face an important resistance at the 100-day moving average (DMA), which is located at $18.40. Piercing through this barrier would pave the way for the bulls to take aim at the next resistance level around the $22 mark.
Buy stocks now with Interactive Brokers – the most advanced investment platform
Disclaimer: The content on this site should not be considered investment advice. Investing is speculative. When investing, your capital is at risk.