
The Buffett Indicator compares the total value of the U.S. stock market to the country’s GDP. Named after Warren Buffett, a legendary investor, and CEO of Berkshire Hathaway (NYSE: BRK.A), who described it as “the best single measure of where valuations stand at any given moment,” this ratio provides insight into whether the stock market is overvalued or undervalued relative to the overall economy.
On July 9, the Warren Buffett Indicator reached 196.19%, marking the highest level in history. This surpasses the peaks observed during the Dot-Com bubble, the Global Financial Crisis, and the 2022 bear market.
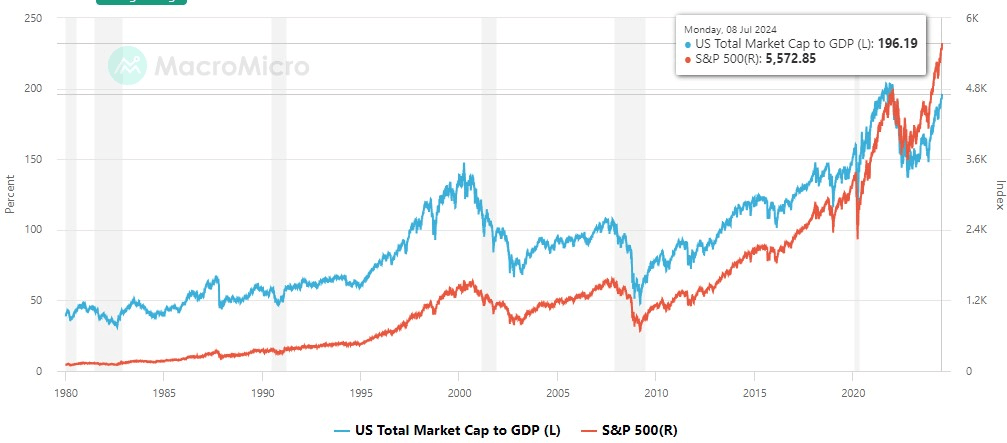
The grey areas on the chart represent significant market downturns, during which the stock market bubbles burst and caused lesser or more significant declines, which can be seen by the duration of these periods.
Why is Warren Buffett’s indicator important?
The Buffett Indicator compares the total market capitalization (share prices times outstanding shares) of all U.S. stocks with the quarterly GDP of the United States economy.
Market conditions are considered normal if the total value of the Wilshire 5000 index, which measures the entire market, is roughly equal to the latest quarterly GDP estimate.
Stocks are deemed undervalued when they are around 70% of GDP. Conversely, stocks trading at about double the size of the economy are considered a significant warning sign.
With a valuation above 190%, the indicator signals a significant overvaluation of the current stock market and might indicate an upcoming market downturn.
How precise is the Warren Buffett indicator?
Since 1971, the Buffett Indicator has provided warning signals ahead of 50% of significant market declines in the U.S.
However, when examining data from 2000 onwards, the indicator successfully predicted approximately 57% of significant market declines.
This might mean that the indicator is getting more precise or downturns are more accessible to predict, as experts and signals are more vigilant than ever.