Technical analysis suggests that the leading digital asset could soon test levels close to the psychologically important $100,000 mark. The most important Bitcoin (BTC) resistance level currently sits at $99,500, and it held firm in the weeks preceding the tariff selloff.
Despite having crashed below $80,000 in the aftermath of the tariff exchange, BTC prices recovered rather quickly. At press time, the leading cryptocurrency was changing hands at a price of $84,750, having rallied by 10.37% in the past seven days.
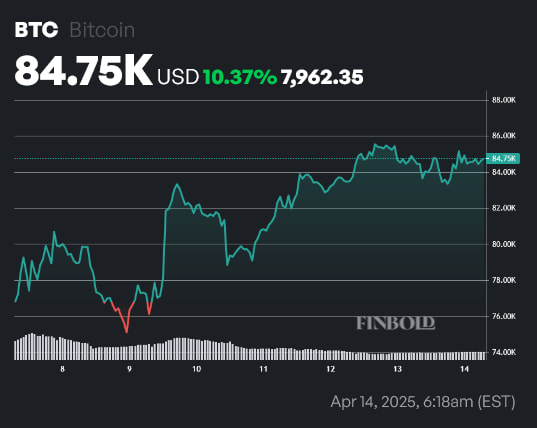
As of the time of writing, Bitcoin is still down 9.38% since the year began. However, a surge to $99,500 would see it back in the green on a year-to-date (YTD) basis. Here’s why that is a distinct possibility.
Bullish divergence suggests Bitcoin resistance will soon be retested
Noted cryptocurrency technical analyst TradingShot outlined several arguments as to why a surge in BTC price could ensue in the immediate term in an April 14 TradingView post.
For one, Saturday’s close on the daily chart is above the asset’s 50-day moving average (MA). This is the first time this has occurred since February 3. Up to this point, price had tested the MA 6 times, only to get rejected in each case.
Moreover, recent price action has breached a trendline of lower highs charted since the January 20 all-time high (ATH) — if just barely.
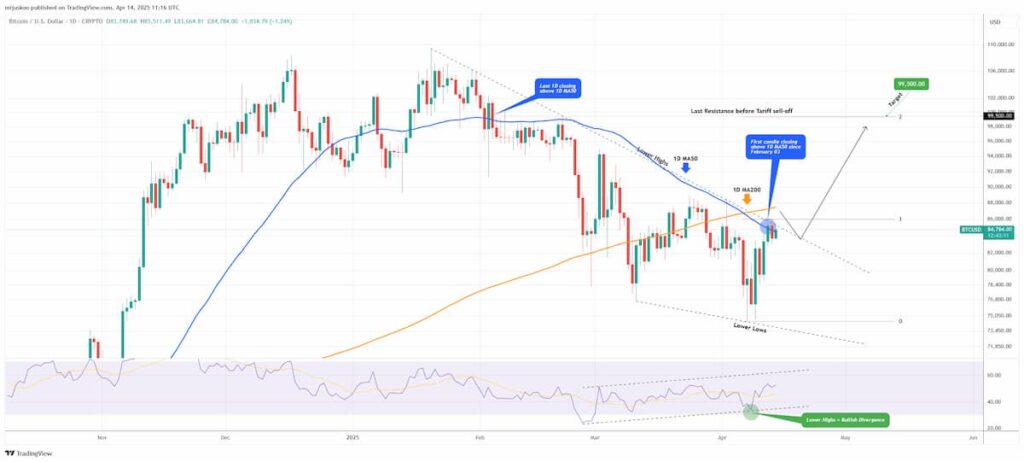
Lastly, all of this has happened in conjunction with Bitcoin marking lower lows in terms of prices, as well as lower highs in terms of its Relative Strength Index (RSI), indicating a bullish divergence that suggests the asset will not trend toward oversold levels going forward.
In such instances, traders use a 2.0 Fibonacci extension level as a price target. This time around, it sits at the $99,500 mark — which happens to be the Bitcoin resistance level that was in effect before the tariff selloff.
However, readers should note that this is far from a foregone conclusion. Despite promising institutional adoption, roughly 25% of Bitcoin’s total supply is currently held at a loss. As positive as a retesting of Bitcoin resistance levels could be, it would also provide ample opportunity for risk-averse investors to liquidate their positions at a profit.
Featured image via Shutterstock