
Super Micro Computer (NASDAQ: SMCI) had a rough time in 2024. The business was one of the last targets of the now-defunct activist short-selling group Hindenburg Research, which alleged that the company was engaging in accounting fraud.
After the release of Hindenburg’s report on August 27, Super Micro stock plummeted — the company delayed the filing of key reports, and its auditor, Ernst & Young (EY), announced that it would not do business with the company going forward. At the time, it seemed quite likely that the company would be delisted from the NASDAQ exchange.
Since then, Supermicro has managed to find a new auditor and secure extensions to file the relevant documents.
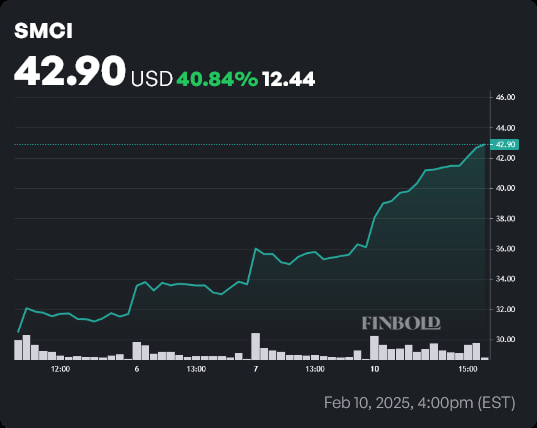
Over the course of the last 5 trading days, the price of SMCI stock has increased by 40.84%. This latest move has brought year-to-date (YTD) returns up to 33.84%, although the price of an SMCI share is still 63.89% away from its March 11, 2024 all time high (ATH) of $118.81.
Amidst this impressive rally, one noted technical analyst believes there’s more room to grow — and that SMCI stock could reach a price of $65 in short order.
Why Supermicro stock has rallied
The cause behind the surge is quite simple. On February 11, the semiconductor company will hold its Q2 2025 earnings call. Even in regular circumstances, the event would provide enough impetus for significant price action.
However, 40.84% in a week is a lot — and it happened because the quarterly report will also include a key update on when the business will file its delayed annual report. As a quick reminder, Super Micro Computer was given a February 25 deadline by the NASDAQ exchange to file its 10-K — but the company could also move to secure a 180-day extension.
Bull flags pattern hints that SMCI stock could test the $65 level
In early February, Super Micro Computer stock broke out of a bull flag pattern, per renowned technical analyst TradingShot. This chart pattern signals bullish continuation — a sudden upward move forms the ‘flagpole’, which is followed by a consolidation period which forms the body of the ‘flag’.
If the pattern is legitimate, once price breaks out of its consolidation phase, it usually makes another upward move — equal to the length of the ‘flagpole’.
As noted by the analyst, last week’s rejection off of the 200-week moving average (MA) on the 1-week timeframe demonstrates a strong support zone in the $23 – $26 range. The ensuing rebound completed the bull flag pattern, as SMCI stock’s latest surge saw prices break out upward.
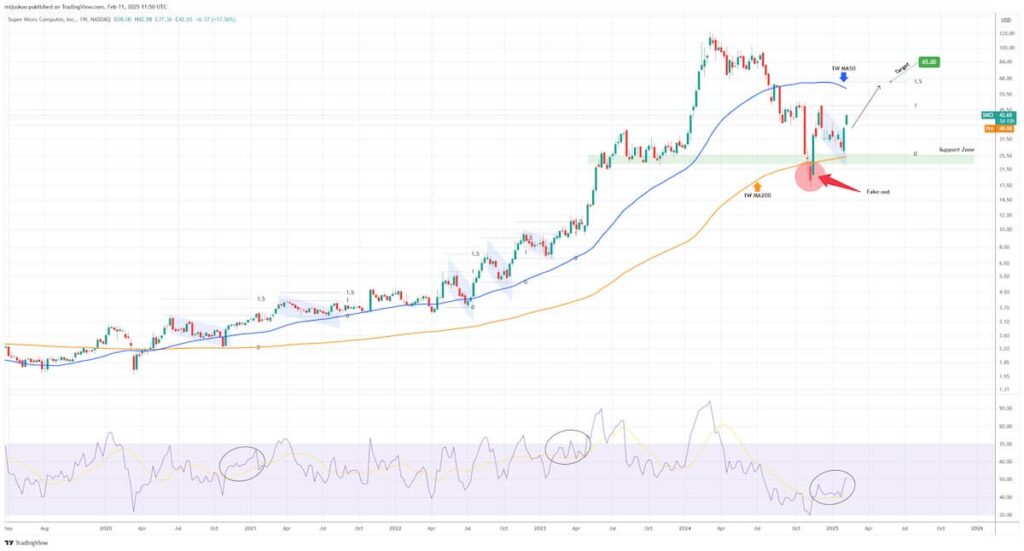
Interestingly enough, TradingShot also highlighted that every bull flag that the stock has seen since the 2020 COVID crash has followed the same pattern. After the price breaks out, it tests the 1.5 Fibonacci extension — a figure based on the intensity of previous price swings, before entering a 2-month pullback.
Should this pattern play out in the same way, Super Micro stock would test the $65 price point, above its 50-week MA on the weekly timeframe, followed by a correction. The analyst is even more bullish in the long run — having previously outlined a case for how SMCI could even test its all-time high.
Readers should note, however, that price action does not occur in a volume — markets might very well react to a deadline extension with a selloff, which would invalidate the thesis.
Featured image via Shutterstock