
In a sharp U-turn, Netflix (NASDAQ: NFLX) has seen a remarkable resurgence in the stock market during 2023, bouncing back from the slump it experienced in 2022 due to a decline in subscriber numbers.
However, despite a promising year-to-date uptrend, NFLX shares recently faced significant selling pressure, plummeting to a fresh four-month low in the latest trading session on September 26.
As uncertainty looms, investors are eagerly awaiting the trajectory of Netflix’s stock price in October. To shed light on the matter, Finbold delved into the realm of quantitative analysis, examining artificial intelligence (AI) prediction algorithms on CoinCodex.
According to the AI-based forecasts, NFLX is projected to trade at $380.46, implying a minor upside of 0.3% from its current share price.
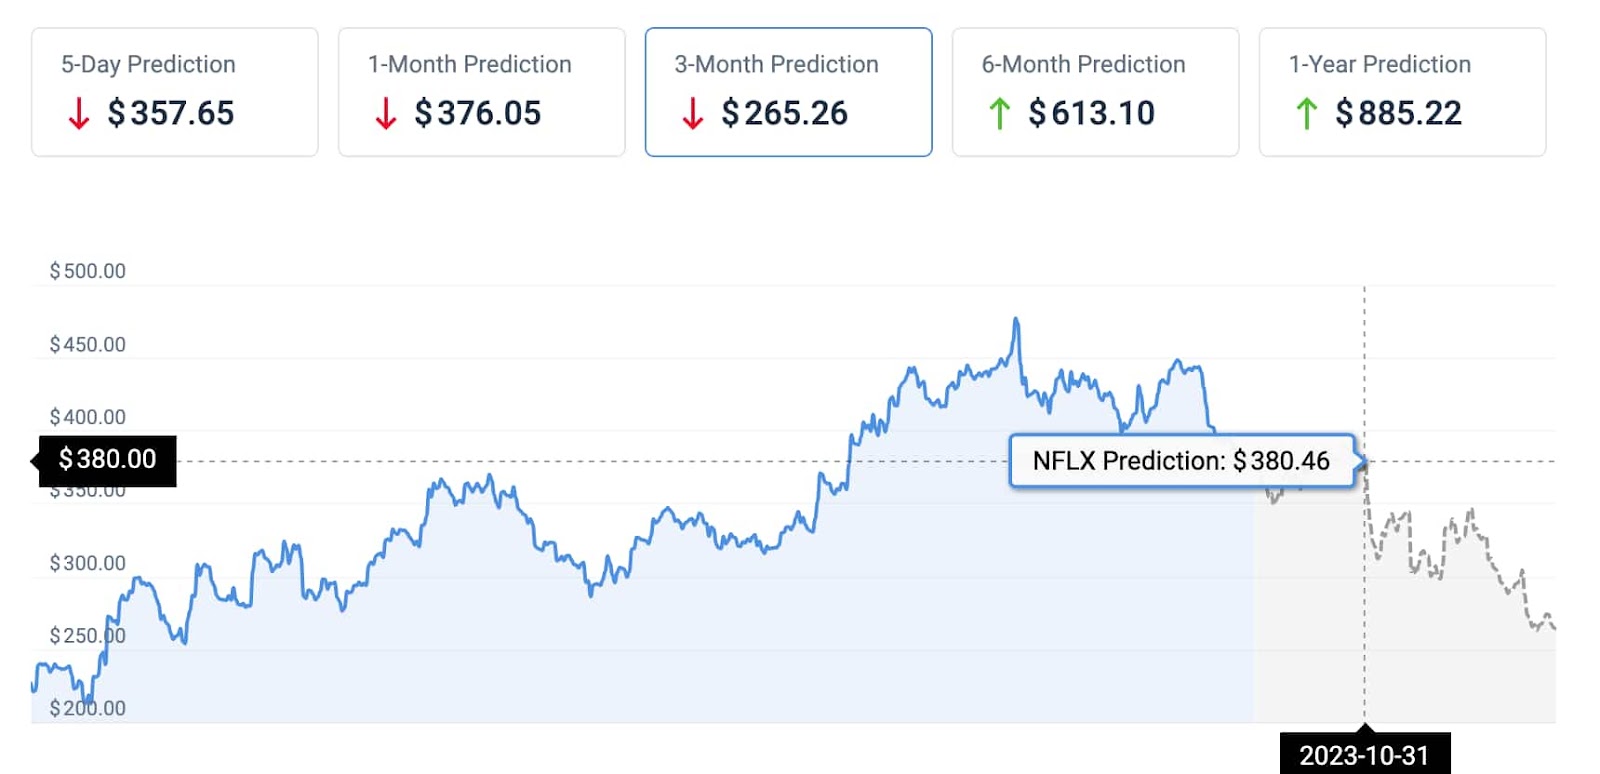
Meanwhile, the algorithms set significantly more ambitious price predictions for their 6-month and 1-year forecasts, estimating NFLX to hit $613 and $885, respectively.
NFLX technical analysis
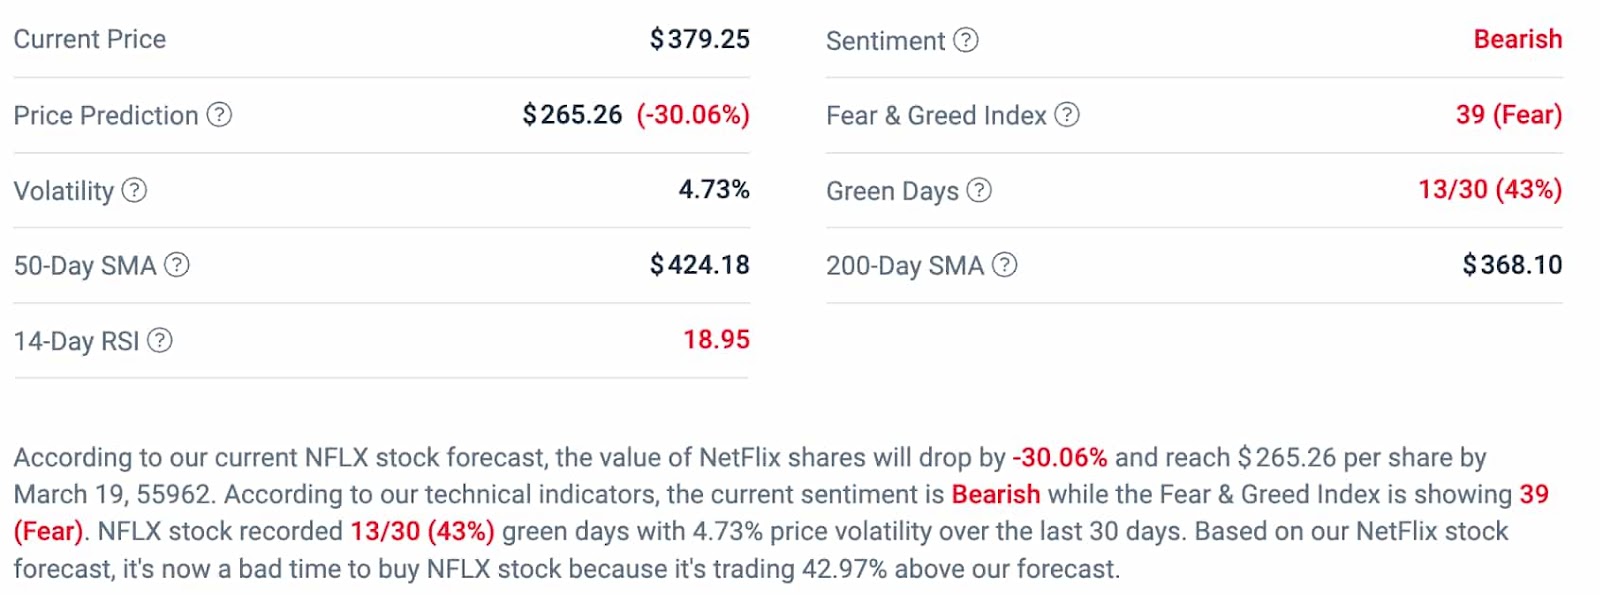
When it comes to the technical overview of Netflix’s stock market performance, indicators on the platform pointed to a largely bearish sentiment surrounding the streaming giant.
In addition, the gauge on the Fear & Greed Index is displaying 39 (Fear), while the stock registered just 13 green days in the past month, with a price volatility of 4.73%.
“Based on our NetFlix stock forecast, it’s now a bad time to buy NFLX stock because it’s trading 42.97% above our forecast.”
– CoinCodex’s analysis states.
On September 26, shares of Netflix slipped by a further 1.44%, closing just below the support level located at $379.25, which previously acted as a strong resistance.
This threshold and the 200-day moving average (MA) at $368.5 form a confluence support, where buying pressure is likely to increase in case of further declines.
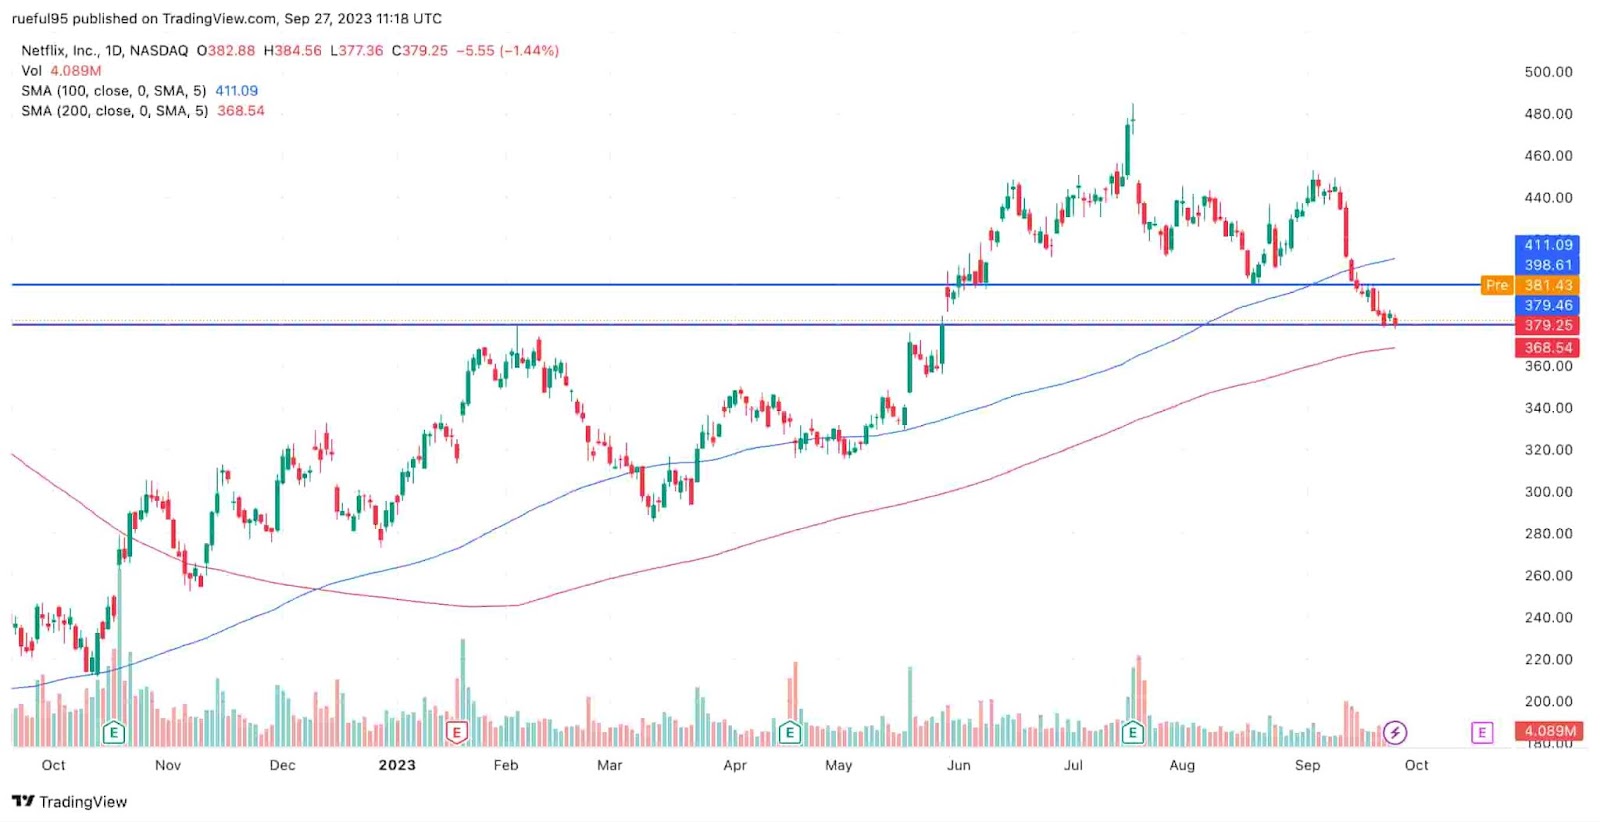
On the upside, the stock faces a confluence resistance zone between the $398.6 level and the 100-day moving average located at $411.
Buy stocks now with Interactive Brokers – the most advanced investment platform
Disclaimer: The content on this site should not be considered investment advice. Investing is speculative. When investing, your capital is at risk.