
While the cryptocurrency sector is yet to recover from the FTX-induced crisis that has sunk its market capitalisation to the lowest levels since 2020, along with the price of Bitcoin (BTC), the flagship crypto is demonstrating the strongest sell signal since 2021.
Specifically, upon observing the price movements of Bitcoin on its 3-day time-frame, experts at TradingShot have noted its moving average convergence divergence (MACD), forming a Bearish Cross since last week, as they said on November 18.
Furthemore, the analysts explained that:
“Since March 2021, we’ve had this formation another four times, all of which delivered a new Low. The September 16, 2021, Cross was limited to ‘only’ a -18% drop, but the other three delivered enormous -50%, -52%, and -57% drops.”
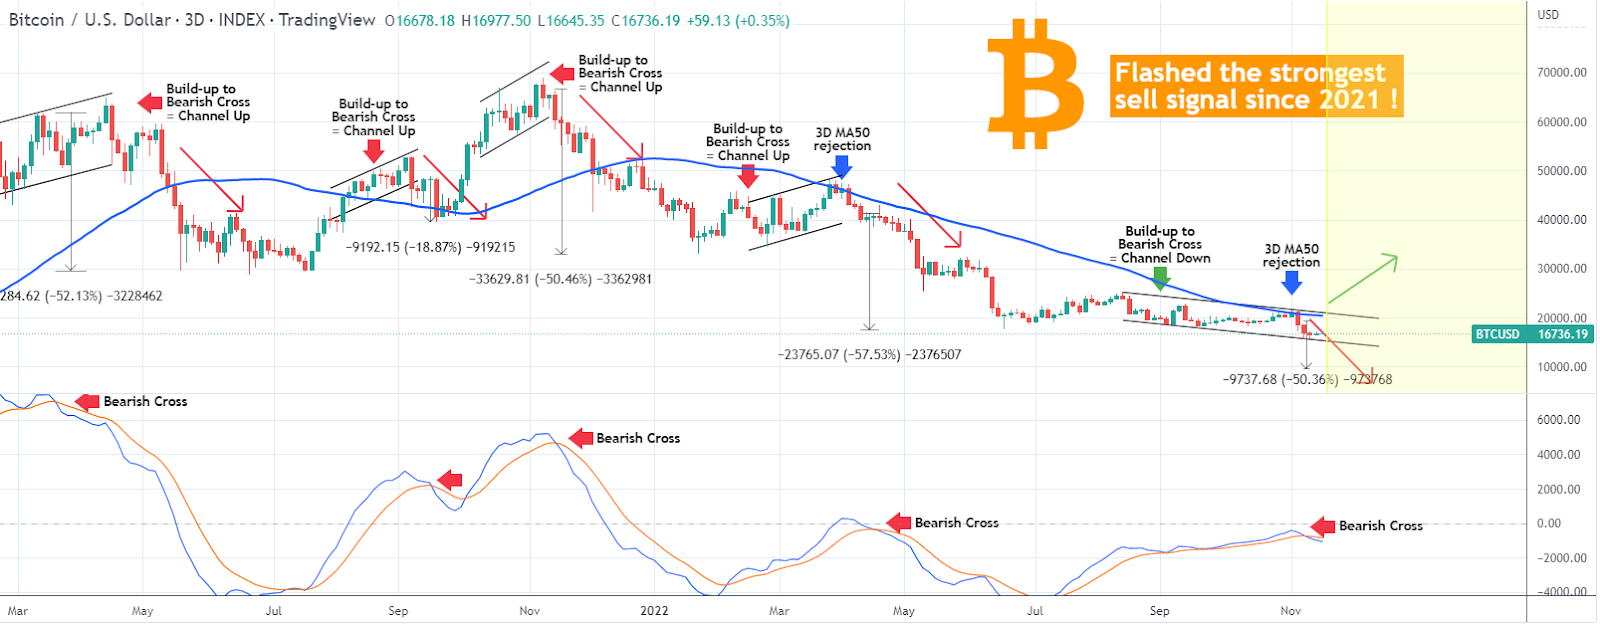
They concluded that “a ‘standard’ (…) -50% drop from today’s Bearish Cross candle would push the price down to a little below the $10,000 barrier, a huge psychological level undoubtedly. Add to the mix that BTC got rejected on its 3D MA50 (blue trend-line), the same it did in late March/early April 2022 before the last MACD Bearish Cross and the -57% drop.”
Chances of increase?
That said, TradingShot did notice a single parameter different from those past events: this time, the build-up to the Bearish Cross is a Channel Down, compared to the Channel Up from the previous occasions.
The analysts weren’t sure whether this would have any effect on the possible outcome but highlighted that there was a chance that this could lead to the end of the bearish pattern. As they explained:
“A good indication that this time it might be different would be if the price breaks above the Channel Down, thus the 3D MA50 (currently at 20386) as well.”
On top of that, the pseudonymous crypto expert known as Moustache earlier noticed that Bitcoin was forming the largest-ever descending broadening wedge, stressing that, historically, the “price has always risen rapidly after that.”
Bitcoin technical analysis
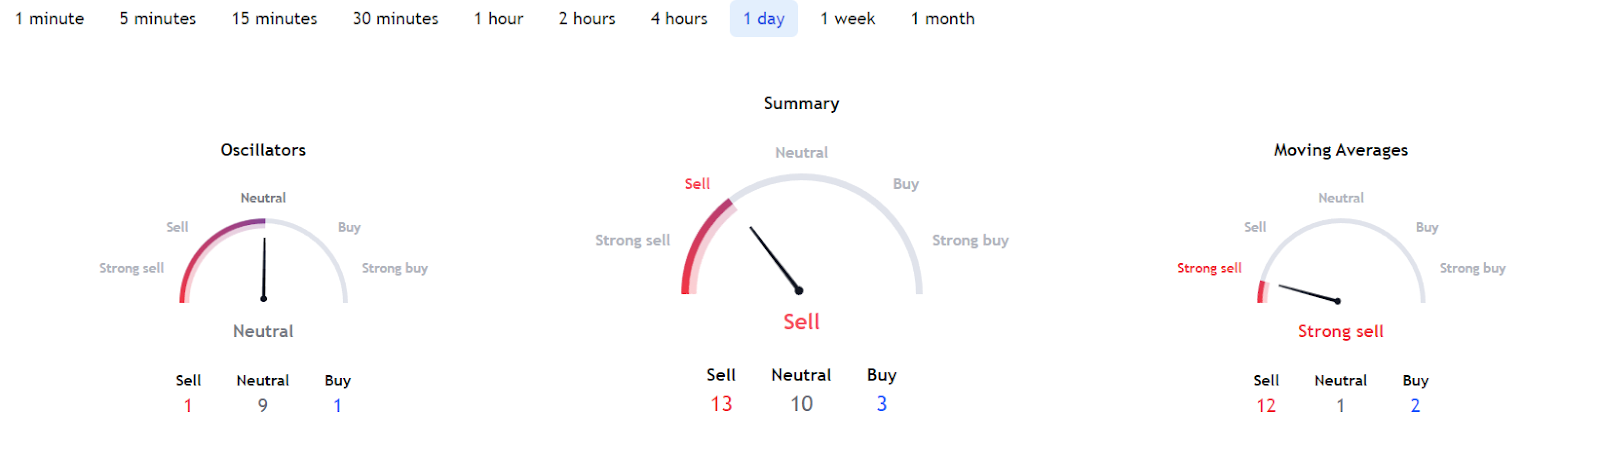
Meanwhile, Bitcoin’s technical analysis (TA) summary stands in the ‘sell’ zone due to the moving averages (MA) indicating ‘strong sell’ at 12 (versus ‘buy’ at 2 and ‘neutral’ at 1), while oscillators remain in ‘neutral’ at 9 and only 1 for both ‘sell’ and ‘buy,’ respectively.
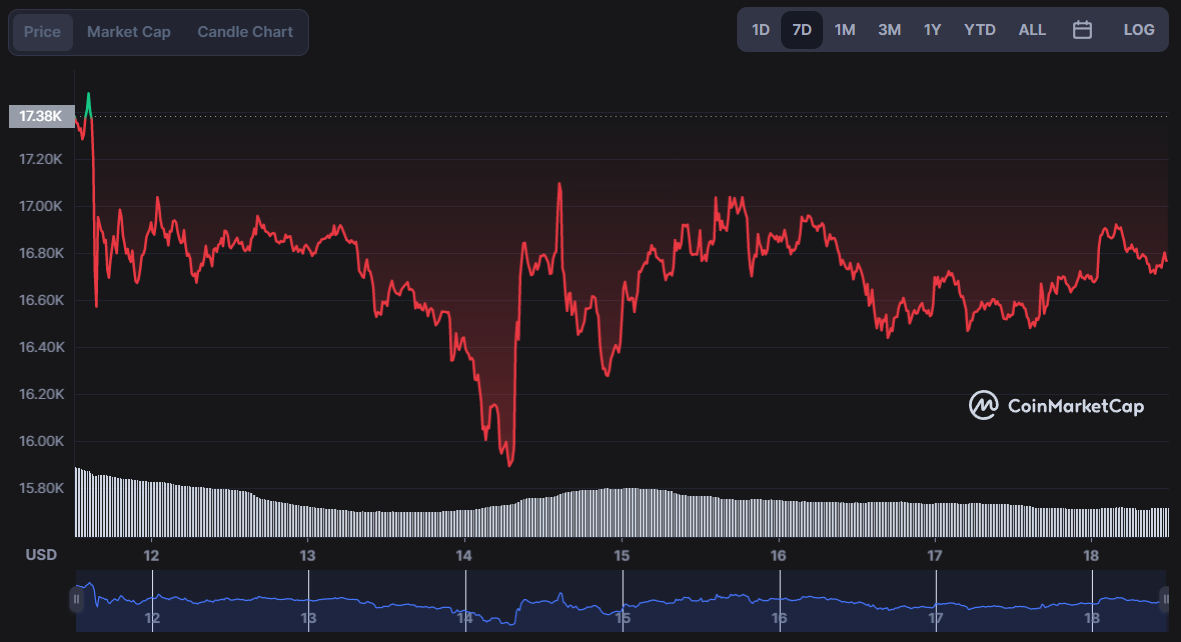
At press time, Bitcoin was changing hands at $16,801, up 1.64% on the day but still down 2.87% across the previous seven days, demonstrating a choppy weekly pattern.
Cumulatively, the maiden decentralized finance (DeFi) asset has lost 12.64% during the past 30 days. With a market capitalisation of $322.12 billion, Bitcoin remains the largest digital currency by this indicator, as per data retrieved by Finbold on November 18.
Disclaimer: The content on this site should not be considered investment advice. Investing is speculative. When investing, your capital is at risk.