
In 2023, Bitcoin (BTC) staged a remarkable comeback, swiftly recovering from a tumultuous 2022. Bolstered by improving macroeconomic conditions, including concerns over inflation and a shift towards less aggressive interest rate hikes, Bitcoin’s price surged, reaffirming its resilience and attractiveness as a digital asset.
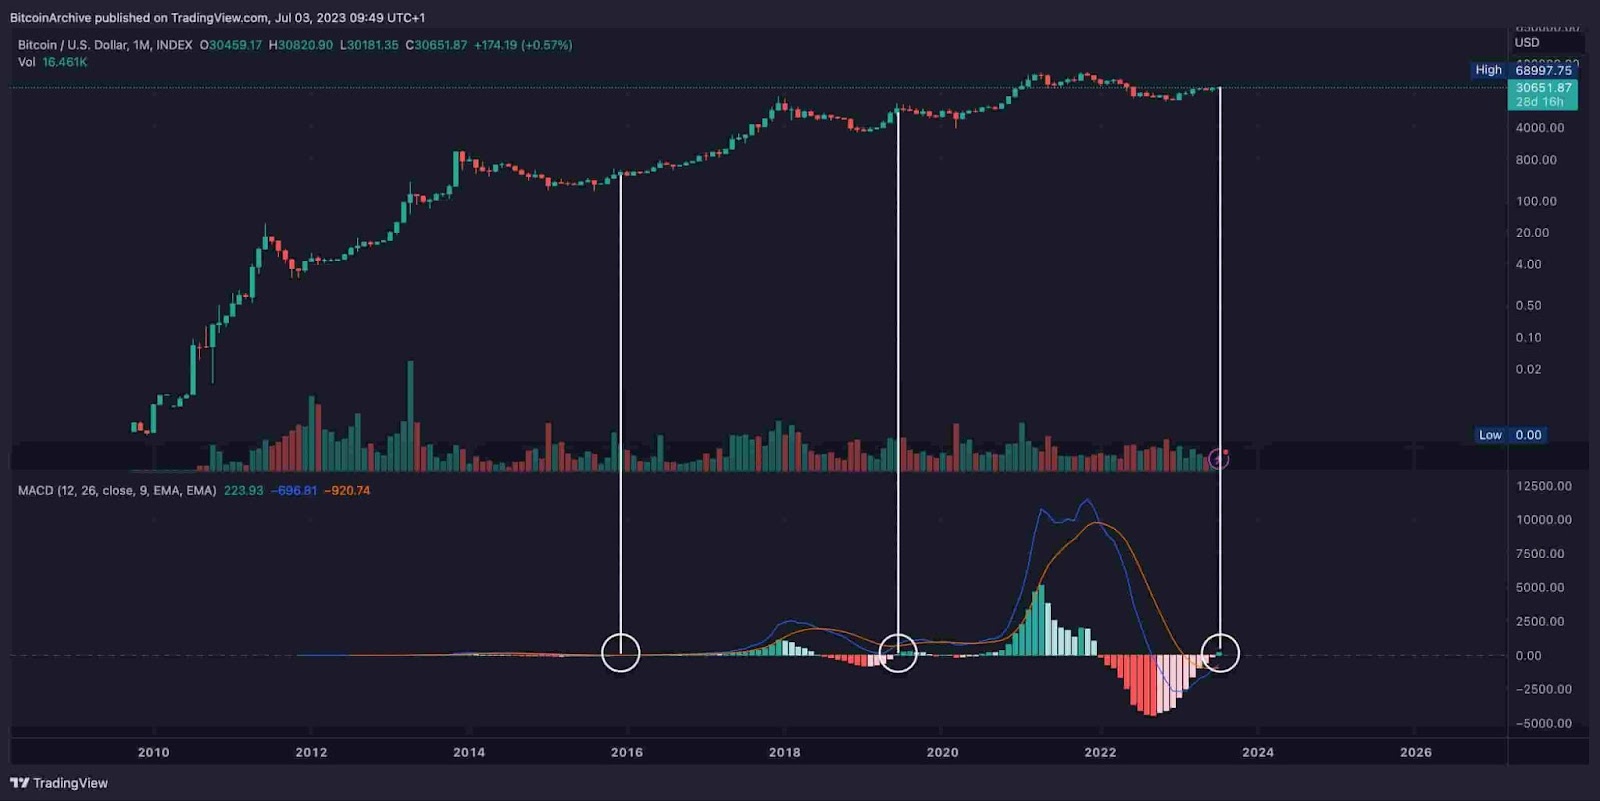
On July 3, the Moving Average Convergence Divergence (MACD), a key technical indicator, just turned green on a BTC monthly chart, likely indicating the start of the bull market for the world’s biggest crypto asset.
What is the MACD and why do investors use it?
The MACD consists of two lines: the MACD line and the signal line. The MACD line measures the difference between two moving averages (MA), while the signal line is a smoothed average of the MACD line, providing buy and sell signals when it crosses above or below the MACD line.
For example, when the MACD line crosses above the signal line, it might be displayed as green, like in this case with Bitcoin. This move indicates a bullish signal or a potential buy opportunity.
Conversely, when the MACD line crosses below the signal line, it might be displayed as red, suggesting a bearish signal or a potential sell opportunity.
Bitcoin price analysis
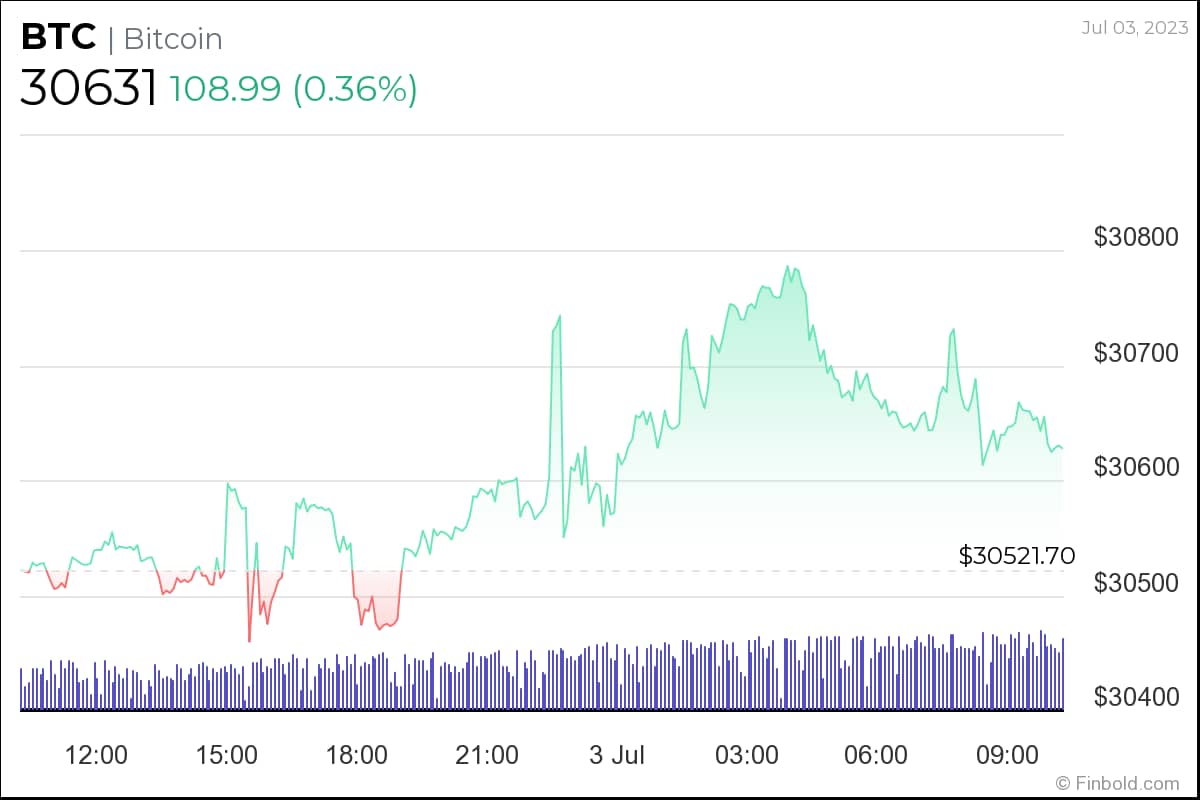
At the time of writing, BTC was changing hands at $30,631, up 0.36% in the past 24 hours.
Over the past month, the cryptocurrency gained over 12.8%, fueled by the hype around institutional crypto adoption after a number of major traditional finance (TradFi) giants filed to launch a spot Bitcoin exchange-traded fund (ETF).
This growing institutional confidence helped to propel the BTC price above $30,000 for the second time this year.
On June 30, a leading crypto market expert Ali Martinez said the world’s biggest crypto coin is currently trading above a key demand area, and, if it stays there, “it has a good chance of advancing toward $35,000 due [to] the lack of resistance ahead.”
On the flip side, if Bitcoin fails to pierce through the $31,000 resistance this week, the crypto coin could slip back down to $28,000 “for a reload option from the bears”, said a popular market analyst known as Crypto Tony.
Disclaimer: The content on this site should not be considered investment advice. Investing is speculative. When investing, your capital is at risk.