Bitcoin (BTC) has crashed again below the $60,000 technical and psychological support following macroeconomic developments and recession fears. The negative price action has created significant resistance to BTC, with a massive volume of potential selling walls that Bitcoin must overcome to seek higher grounds above $70,000.
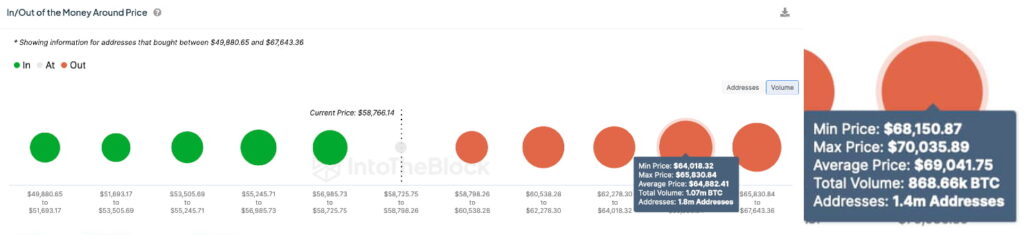
Finbold retrieved on-chain data from IntoTheBlock on August 4, seeking to identify potential seeling walls and price resistance. In particular, we looked at the BTC volume that is out of the money at each price range. These Bitcoin holders could be more willing to sell at a breakeven price to risk-off amid global uncertainties.
Notably, nearly 4.15 million BTC have been purchased at prices higher than $60,842, worth over $242.75 billion. These potential selling walls are distributed in five price ranges from $60,900 to $70,035, as follows:
- 267,180 BTC from $58,798 to $60,538, at an average price of $59,814;
- 552,230 BTC from $60,538 to $62,278, at an average price of $61,464;
- 549,010 BTC from $62,278 to $64,018, at an average price of $63,215;
- 1.07 million BTC from $64,018 to $65,830, at an average price of $64,882;
- 850,400 BTC from $65,830 to $67,643, at an average price of $66,743;
- 868,660 BTC from $68,150 to $70,035, at an average price of $69,041.
Bitcoin MVRV signals a local bottom
On the other hand, the buying side has a proportionally lower BTC volume, suggesting weaker price support. This side is made of coins purchased at a lower exchange rate than Bitcoin’s current one, encouraging renewed interest.
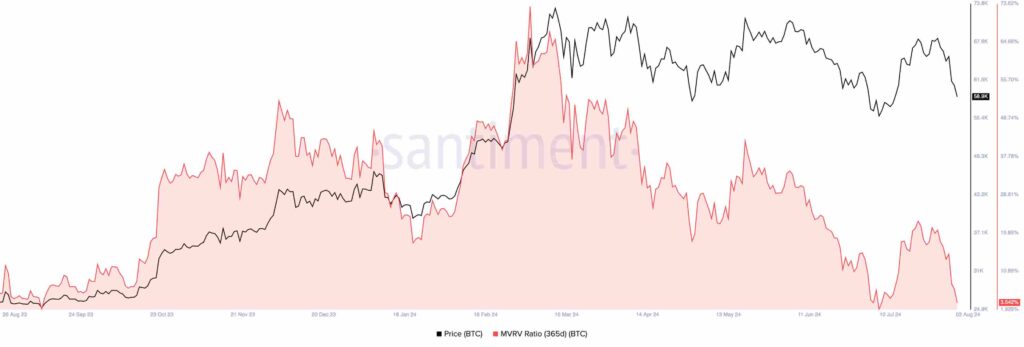
Nevertheless, the leading on-chain indicator, the Market Value to Realized Value (MVRV) ratio, points toward a possible zone of interest. Finbold retrieved data from Santiment, looking at the 365-day MVRV ratio, signaling a potentially ending selling pressure at these prices.
This is because the indicator measures how much the average BTC purchases in the last 365 days are profiting at this exchange rate. The higher the MVRV, the more likely these investors are to sell, seeking value realization.
Meanwhile, the lower the ratio, the more likely these addresses are to hold their BTC, looking for a better opportunity. As of this writing, Bitcoin trades at $58,900 with a 3.5% 365-day Market Value to Realized Value ratio.
Whether Bitcoin is dropping further or bouncing back to higher ground will depend on multiple factors. Right now, there are relevant macroeconomic uncertainties leading investors to risk off and wait. Cryptocurrencies can be highly influenced by overall speculation, requiring extra caution from traders and investors.
Disclaimer: The content on this site should not be considered investment advice. Investing is speculative. When investing, your capital is at risk.