
Bitcoin (BTC) consolidation around the $20,000 level continues to play out, with the flagship cryptocurrency appearing to stabilize around the region amid the sustained crypto winter. However, investors are monitoring the asset’s price trends for signals on the next action.
One of the tools leveraged in determining possible Bitcoin price action is the Bitcoincenter’s rainbow price chart. The chart highlights how past Bitcoin prices can offer a glimpse of how the asset could potentially perform in future.
In the long term, if the historical pattern is sustained, the chart suggests that Bitcoin could reach a six-figure value of $626,383 by October 9, 2024, when the flagship cryptocurrency will hit the ‘Maximum Bubble Territory’ represented by the dark red color.
Possible crypto winter bottom
At the same time, the chart indicates that the current crypto winter might have bottomed. Notably, the current Bitcoin price of about $19,500 is rated under the ‘Basically a Fire Sale’ zone represented by the color blue.
Historically, the last time Bitcoin attained the level was in March 2020, when the asset traded for almost $5,000. Consequently, Bitcoin embarked on a rally culminating in an all-time high of nearly $69,000 by the end of 2021.
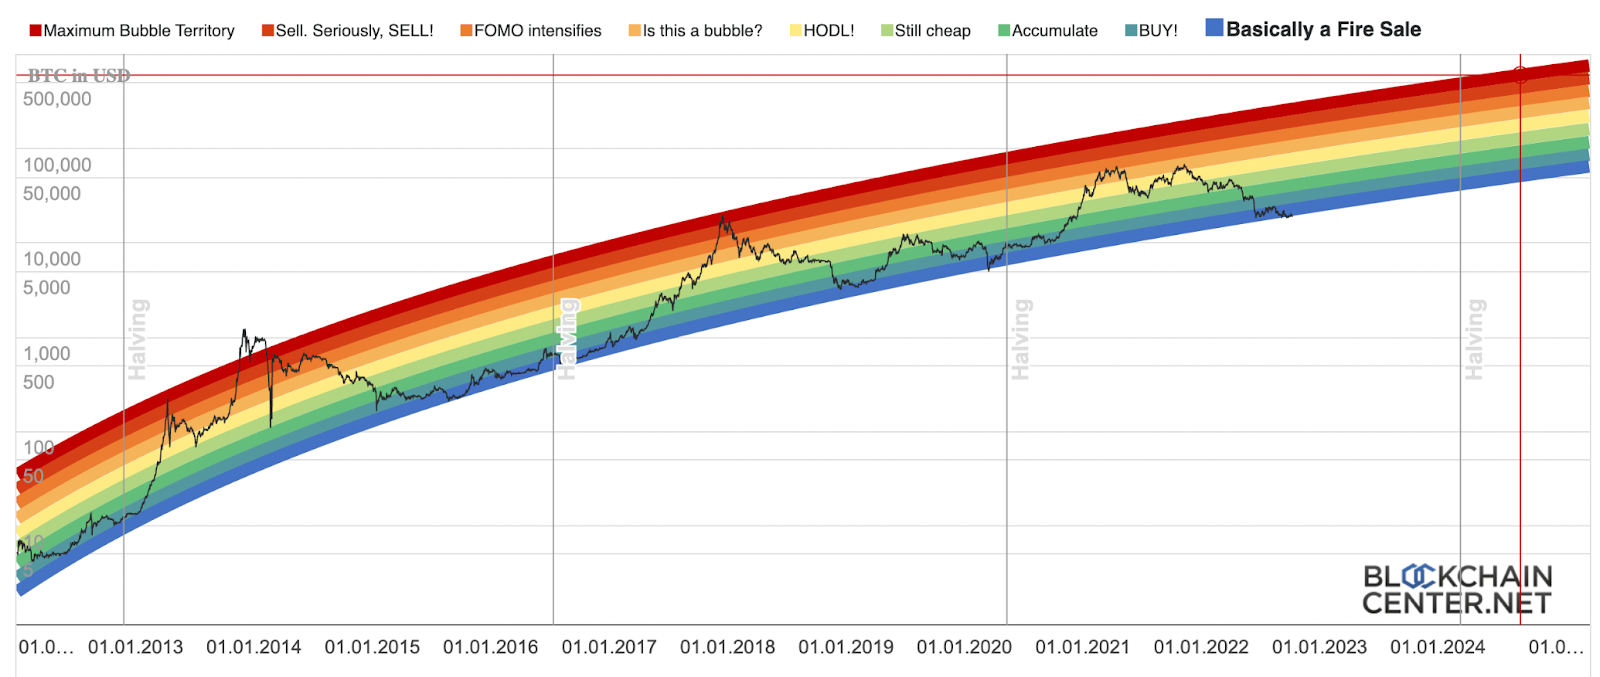
In the run-up to the bullish trend, the rainbow chart also shows Bitcoin ‘HODL’ status will kick in at the end of the year when the asset trades at $86,151.
Rainbow chart caution
It is worth noting that the rainbow chart bands have been adjusted over time to better fit past performances. At the same time, the color bands only follow logarithmic regression and are not part of the scientific basis. Notably, the creators of the chart note that the it is a fun way of looking at Bitcoin’s potential future performance.
In the meantime, Bitcoin has recorded some stability in the last seven days. By press time, the asset was trading at $19,511 with weekly gains of almost 2%.
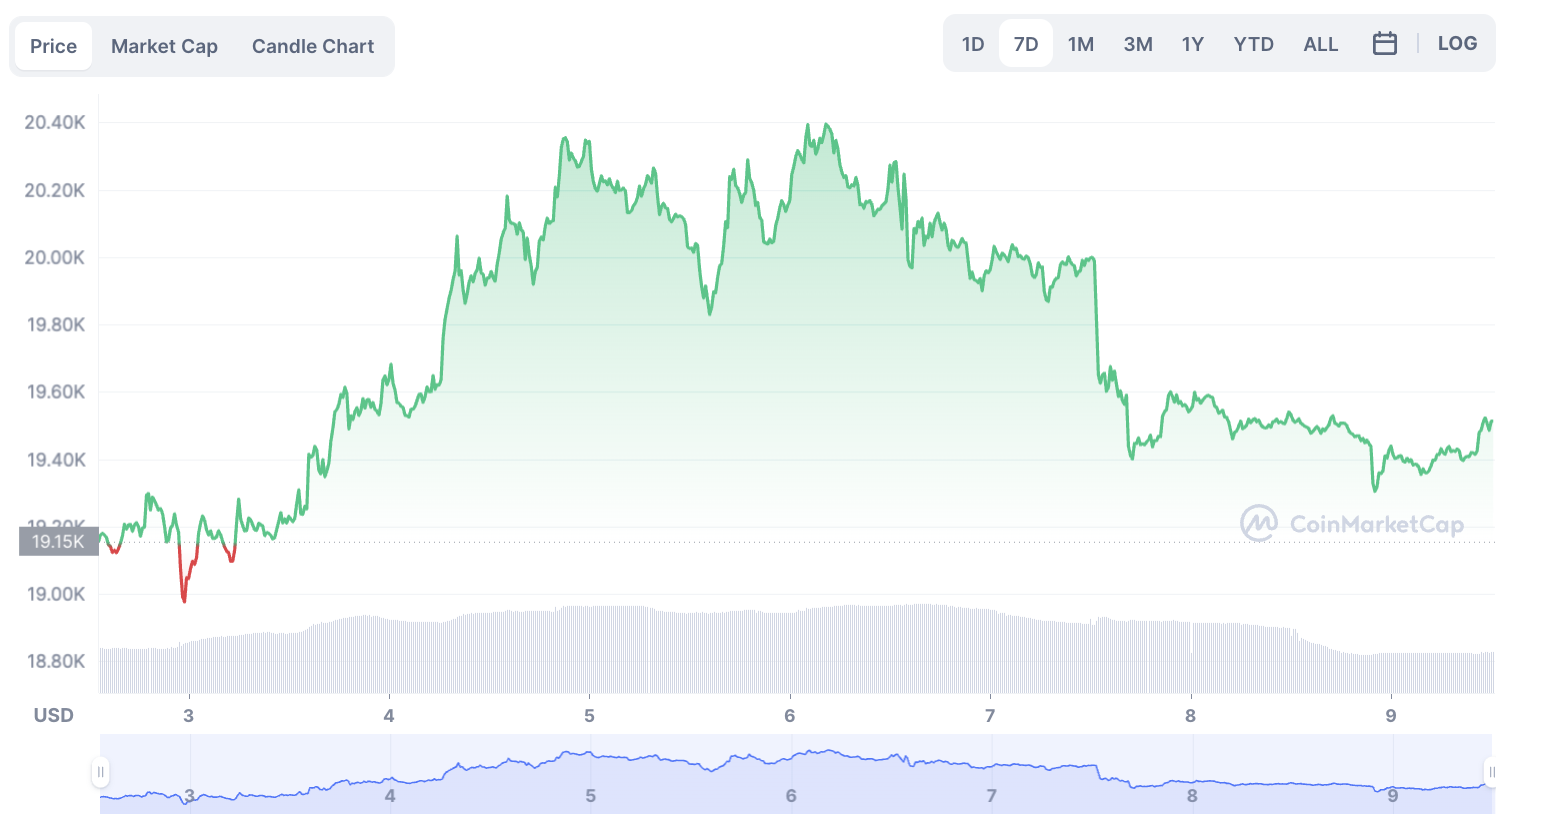
The stability has also been experienced in the asset’s market cap, which stands at about $374.14 billion, according to CoinMarketCap data.
Disclaimer: The content on this site should not be considered investment advice. Investing is speculative. When investing, your capital is at risk.