
The Bitcoin (BTC) Rainbow Chart currently places the cryptocurrency in its ‘Basically a Fire Sale’ band, the model’s cheapest zone, with its end-of-July 2026 reference price set at $63,349.
Notably, the Rainbow Chart is a long-term Bitcoin valuation model based on its logarithmic growth trend. It uses color-coded bands to show whether BTC appears relatively cheap or expensive compared to its historical price trajectory.
For July 29, 2026, the model’s top band is ‘Maximum Bubble Territory’ at $516,758, a euphoric top that has historically preceded sharp corrections.
Just below it sits ‘Sell. Seriously, SELL!’ at $397,506, a late-cycle warning zone, followed by ‘FOMO Intensifies’ at $305,774, marking the point where retail buying accelerates.
From there, ‘Is This A Bubble?’ sits at $235,211, where momentum starts turning speculative, while ‘HODL!’ at $180,931 represents a fair-value, hold-and-wait zone.
Further down the scale, ‘Still Cheap’ comes in at $139,178, a below-average valuation reading, and ‘Accumulate’ follows at $107,060, a historically favorable buying zone.
‘BUY!’ sits at $82,354 as a strong-value signal, and the lowest band, ‘Basically a Fire Sale,’ closes out the chart at $63,349, the deepest discount tier the model offers.
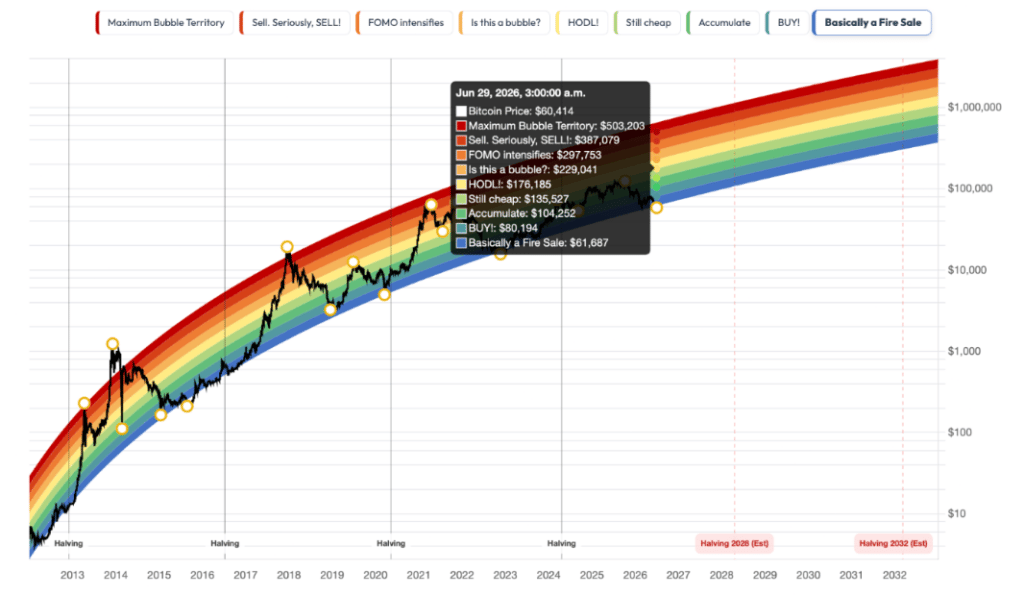
With BTC at $58,581, the current price sits below even that ‘Fire Sale’ line. In Rainbow Chart terms, that reading implies Bitcoin is trading at a rare discount relative to its long-term logarithmic growth curve.
Bitcoin price fundamentals
That gap between the model and the market lines up with a genuinely rough stretch for Bitcoin. BTC fell roughly 19% in June, well off its historical average gain of 5.90% for the month, and May also broke from its seasonal pattern, dropping 3.5% against an 18% historical average.
Much of the move traces back to institutional flows. In this line, U.S.-listed Bitcoin ETFs recorded $4.5 billion in net outflows in June 2026, the worst monthly figure.
Meanwhile, U.S. spot Bitcoin ETF outflows reached roughly $4.06 billion for the month, the largest monthly redemption since launch and well above the previous record of $3.56 billion set in February 2025.
Analysts have linked the selloff to capital rotation amid macroeconomic uncertainty and investor interest surrounding SpaceX’s IPO.
Bitcoin short-term price forecast
Short-term forecasts now hinge on whether Bitcoin can hold support near $58,000. A break below $55,300 would confirm a bearish head-and-shoulders breakdown, potentially sending BTC toward $52,458, $48,413, and ultimately near $42,000.
If support holds, Bitcoin could recover toward $65,600-$70,000 by the end of July. A more gradual rebound would require reclaiming the 20-day EMA near $62,450 and clearing resistance around $64,000-$64,100, opening the door to $66,600-$67,600.
However, a drop below $58,200 could expose $56,200.