
Bitcoin (BTC) is preparing for a fresh price breakout, as indicated by two classic technical indicators, according to a recent analysis shared by popular trader Roman on X (formerly Twitter).
Despite prevailing bearish sentiments, Bitcoin has been consolidating above $63,000 after facing resistance at the $70,000 mark. This period of consolidation, while disappointing for holders in June, is viewed as a healthy correction within an ongoing bull market.
Key indicators: RSI and Bollinger Bands
Roman emphasizes the importance of the Relative Strength Index (RSI) and Bollinger Bands on the weekly chart, which signal a potential upside. The RSI, a momentum oscillator, measures the speed and change of price movements and is often used to identify overbought or oversold conditions.
Bollinger Bands, comprising a middle band (simple moving average) and two outer bands (standard deviations from the average), are used to identify volatility and potential price breakouts.
The chart analysis reveals a third bullish divergence between Bitcoin’s price and the RSI. This divergence is shown by lower lows in the RSI not being matched by lower lows in the price, indicating weakening bearish momentum. This pattern is a strong bullish signal, often preceding significant price increases.
Additionally, the Bollinger Bands are narrowing, signaling reduced volatility. This “squeeze” often precedes significant price movements. With the RSI showing bullish divergence, the bias is towards an upward breakout.
Roman’s analysis suggests that Bitcoin’s recent consolidation is part of a healthy correction within a larger bull market. The RSI divergence and the tightening of Bollinger Bands both point towards a substantial price move.
Roman projects a target of $90,000, a significant increase from current levels. Traders and investors are advised to monitor the weekly close for further confirmation of the bullish continuation.
Bitcoin price analysis
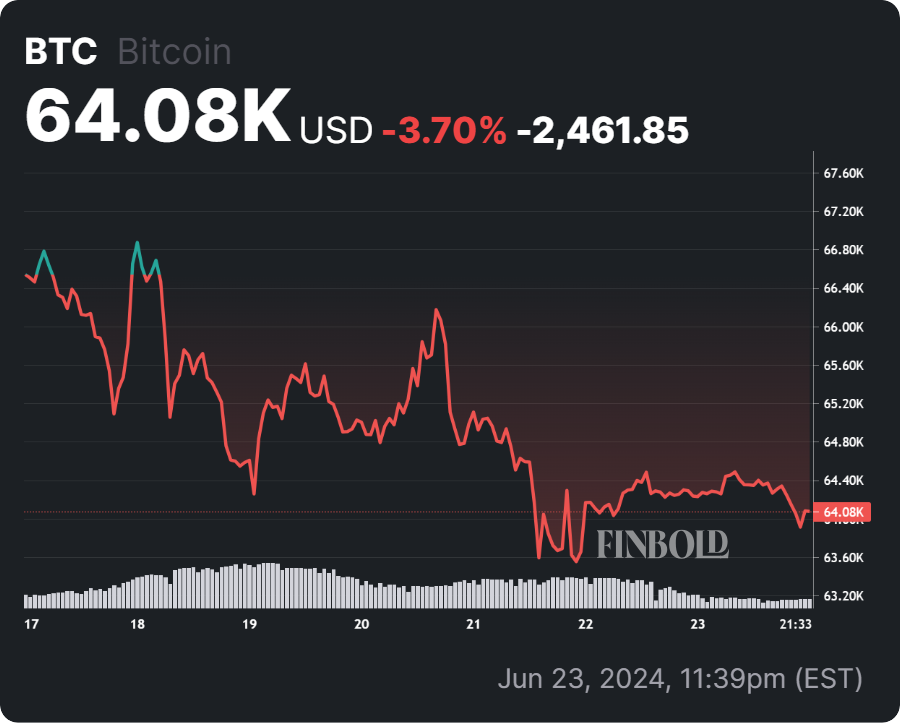
Bitcoin is currently trading at $64,040, reflecting a 0.34% decline in the last 24 hours and a 3% drop over the past week, accumulating a 6% loss on its monthly chart. Interestingly, according to QCP Capital, Bitcoin’s price consolidation is likely to continue for the next two months, with a potential bull run not expected until late 2024.
Monitoring high time frame signals is crucial, as Bitcoin’s consolidation phase might soon give way to explosive growth, targeting new highs beyond current levels.
With key technical indicators like the RSI showing bullish divergence and the Bollinger Bands tightening, the groundwork is being laid for a significant price move.
While a potential bull run might not be expected until late 2024, traders and investors should stay vigilant, as these signs suggest that Bitcoin is gearing up for a major breakout.
Disclaimer: The content on this site should not be considered investment advice. Investing is speculative. When investing, your capital is at risk.