
Bitcoin (BTC) experienced a crash following macroeconomic uncertainties, which a crypto trader sees as a positive signal based on historical patterns. This could be the last piece of a “super bull rally” puzzle, looking at a theoretical Bitcoin’s seven-year super cycle.
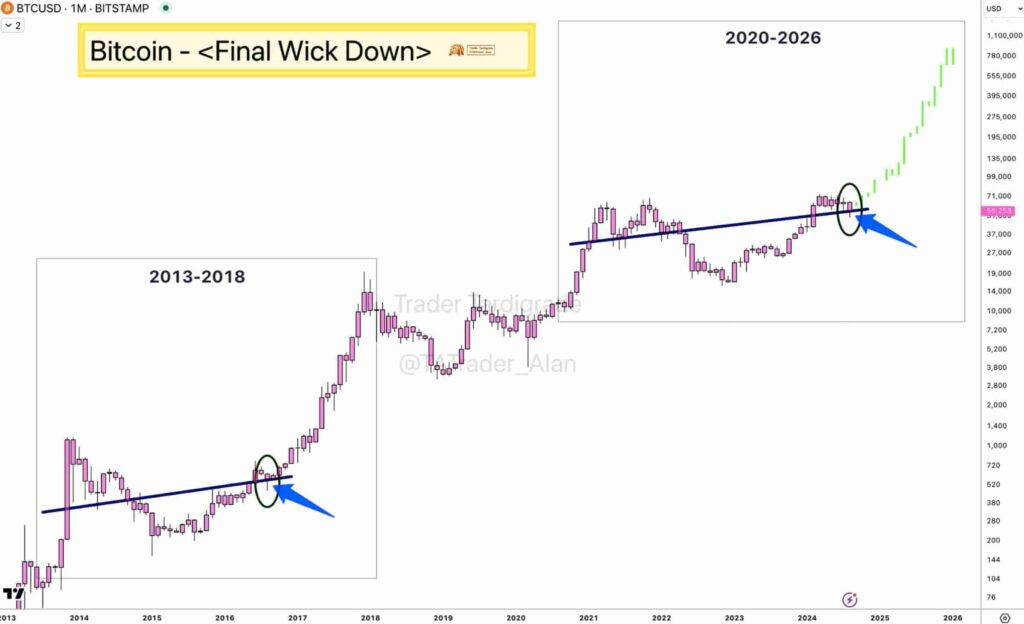
On that note, Trader Alan shared a long-term BTC price technical analysis on X, posted on August 6. Alan celebrated the recent crash that “finally printed a wick down under the support line,” mirroring the previous super cycle.
As analyzed, Bitcoin price made a similar move in 2016, triggering a “super bull rally” that ended in 2018. According to the analyst, this new “wick down” could send BTC to another all-time high in the following years.
Picks for you
However, it is important to understand that the proposed pattern only happened once; thus, it requires validation in this cycle. Moreover, past events do not guarantee future action. Bitcoin and the cryptocurrency market have changed a lot in the last decade, having a huge impact on historical analyses.
The ‘super bull rally’ theory for Bitcoin’s price
Notably, Trader Alan drew a super six-year cycle from 2013 to 2018 made of two impulses following a smaller one. The first impulse is not considered in this analysis, happening in early 2013 and 2019.
Therefore, the analyst compares the impulse in mid-2013 to a local top in 2014, followed by a two-year consolidation period. Something similar happened in mid-2021, consolidating between 2022 and 2023.
After this accumulation level, Bitcoin’s price experienced a crash in 2016, forming a one-month candlestick wick below a key support. The bear trap acted then as a trigger to a “super bull rally” to $20,000 and a massive altseason benefiting other cryptocurrencies.
According to Trader Alan, this past price action could repeat this time if BTC confirms a strong momentum. The chart illustrates a “super bull rally” to above $780,000, although investors must understand that Bitcoin had far less liquidity and market capitalization in the past cycle – which may cause the price to not exactly reproduce the past length, as already happened in the first impulse.
If history repeats, not only can BTC experience a significant surge in the following months, but altcoins can also outperform the leader. Nevertheless, investors must be cautious and consider the macroeconomic uncertainties and recession fears before allocating capital or leveraging positions.
Disclaimer: The content on this site should not be considered investment advice. Investing is speculative. When investing, your capital is at risk.