
The cryptocurrency market is still not in the clear from the consequences of the collapse of FTX, once one of the largest crypto exchanges in the world. Still, some of its assets, like Bitcoin (BTC), are making shy gains, and some indicators are suggesting these gains could intensify soon.
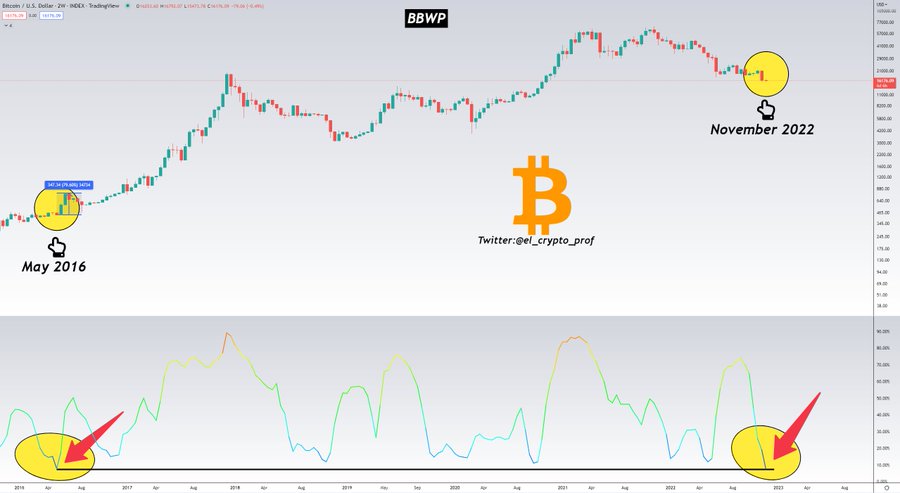
Indeed, taking into account the Bollinger Band Width Percentile (BBWP) indicator, which is the lowest it has been in over six years on the two-week chart for Bitcoin, the flagship digital asset could be bracing for a dramatic upward move.
Specifically, in May 2016 – the last time this indicator was demonstrating similar low values to how it currently is, Bitcoin had gained about 80% within the following four weeks, the pseudonymous crypto analyst Moustache said on November 28.
Technical indicators stack up
At the same time, another technical analysis (TA) indicator suggests a bounce could be in the cards for the maiden decentralized finance (DeFi) token, as explained by the prominent crypto analyst Trader Tardigrade earlier on November 28.
This indicator is the Price Momentum Oscillator (PMO), typically based on a Rate of Change (ROC) calculation that is smoothed twice with exponential moving averages (MA) that use a custom smoothing process. It oscillates in relation to a zero line.
In Bitcoin’s case, Trader Tardigrade explained that the PMO is currently under zero, which, combined with being “in contact with the curved support,” could “trigger a bounce,” which, according to the expert’s chart, could happen sometime in 2023, toward 2024, possibly peaking at around $24,000.

Earlier, the cycle channel oscillator (CCO) entered the bear market bottom and a perfect area to dollar cost average Bitcoin, which could lead it to make a bullish push, as per the analysis by crypto expert Mags, reported by Finbold.
Bitcoin price analysis
As things stand, Bitcoin is changing hands at the price of $16,504, up 1.63% on the day, as well as 4.87% across the previous seven days, although its losses on the monthly chart amount to 20.57%, as charts show.
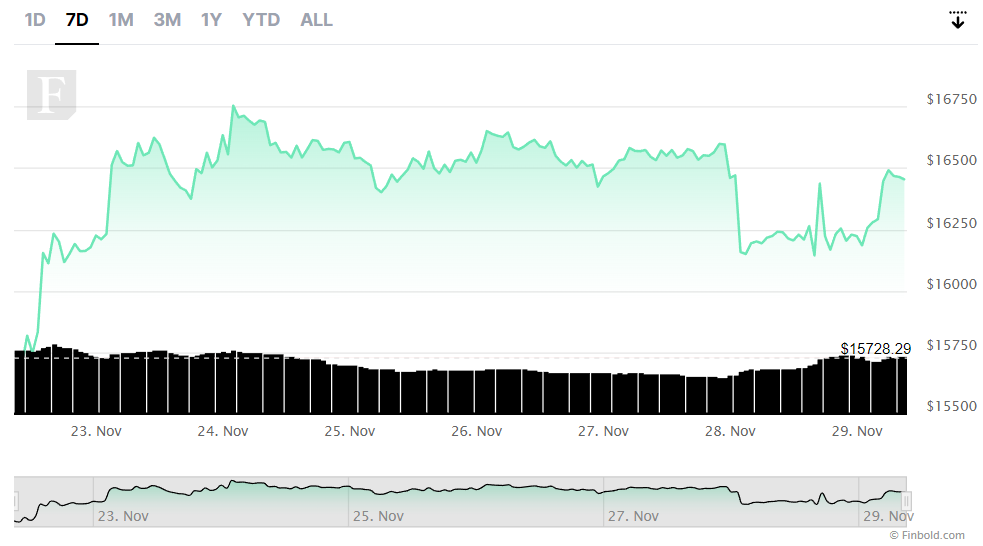
With a market capitalization of $317.01 billion, Bitcoin retains the position of the largest cryptocurrency on the market by this indicator, according to CoinMarketCap data retrieved by Finbold on November 29.
Disclaimer: The content on this site should not be considered investment advice. Investing is speculative. When investing, your capital is at risk.