
The global cryptocurrency market cap today is $2.25 trillion, reflecting a 0.2% increase in the last 24 hours.
Despite this slight uptick, the market sentiment remains notably bearish, as evidenced by the Crypto Fear & Greed Index plummeting to “extreme fear” – a level not seen since January last year, according to sources.
This decline in sentiment is largely due to Bitcoin’s recent struggles to break above the $60,000 mark.
In this context, Finbold analyzed the Relative Strength Index (RSI) heatmap from CoinGlass and other technical indicators on July 12 to identify potential buy signals.
The average daily RSI is currently at 40.046, indicating neutral market conditions. However, certain assets can be considered as buy candidates based on their RSI values and technical outlook.
MANTRA (OM)
MANTRA (OM) is showing strong buy signals based on its RSI values and other technical indicators. The RSI values across various timeframes for OM are impressive, with a 15-minute RSI of 48.11, a 1-hour RSI of 50.06, and a 4-hour RSI of 60.68, suggesting growing buying interest.
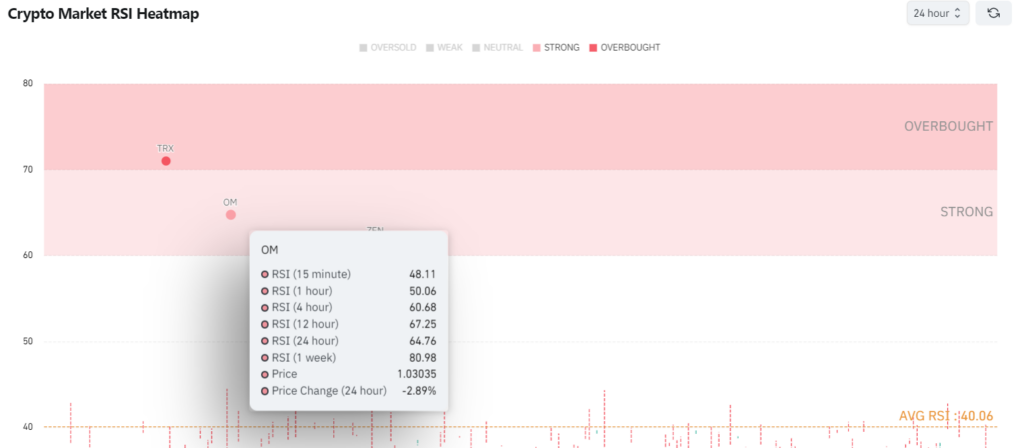
The more significant 12-hour RSI of 67.25 and 24-hour RSI of 64.76 indicates a robust upward momentum. The weekly RSI of 80.98 underscores the sustained buying pressure. Despite a 24-hour price drop of 2.89%, this decline can be seen as a buying opportunity, as the overall RSI trend remains positive.
Beyond RSI, other technical indicators also point to a bullish outlook for OM. The Moving Average Convergence Divergence (MACD) indicator shows a bullish crossover, suggesting that the price trend is upward.
The Exponential Moving Averages (EMAs) on various timeframes, such as the 10-day and 50-day EMAs, indicate a strong buy signal, reinforcing the potential for an upward price movement.
Additionally, the Commodity Channel Index (CCI) and Average Directional Index (ADX) also suggest a bullish trend, supporting the positive outlook for OM.
Horizen (ZEN)
Horizen (ZEN) also shows strong buy signals based on its technical indicators. The short-term RSI values, such as the 15-minute RSI of 34.98 and the 1-hour RSI of 32.02, indicate that ZEN is currently oversold, suggesting a possible rebound.
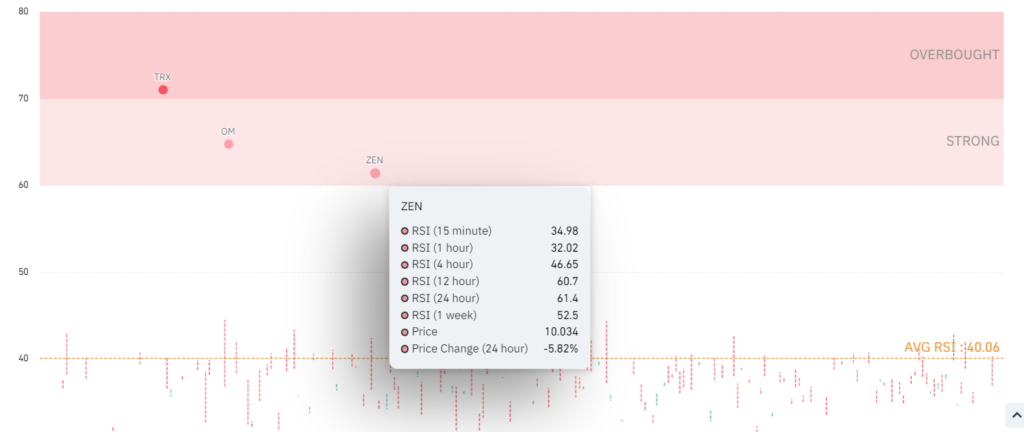
The 4-hour RSI of 46.65 and 12-hour RSI of 60.7 highlights increasing buying interest. The 24-hour RSI of 61.4 and the weekly RSI of 52.5 further confirm a steady buying trend. Although ZEN experienced a 5.82% price drop in the last 24 hours, the RSI values indicate a likely recovery.
Additional technical indicators bolster this positive outlook for ZEN. The MACD shows a bullish crossover, indicating a potential price increase.
The EMAs across various timeframes suggest a strong buy signal, as the shorter-term EMAs are above the longer-term ones. Furthermore, the CCI and ADX indicators point to a strengthening trend, which supports the bullish case for ZEN.
In short, both Mantra and Horizen demonstrate strong buy signals, supported by comprehensive technical analysis.
While the aforementioned indicators suggest potential price increases, the cryptocurrency market remains volatile. Always conduct thorough research, including fundamental analysis, before making any investment decisions
Disclaimer: The content on this site should not be considered investment advice. Investing is speculative. When investing, your capital is at risk.