
After a period of difficulty, the largest digital assets on the cryptocurrency market are finally recording some noticeable gains, including Ethereum (ETH), leading analysts to identify crucial levels that will further propel its bullish move.
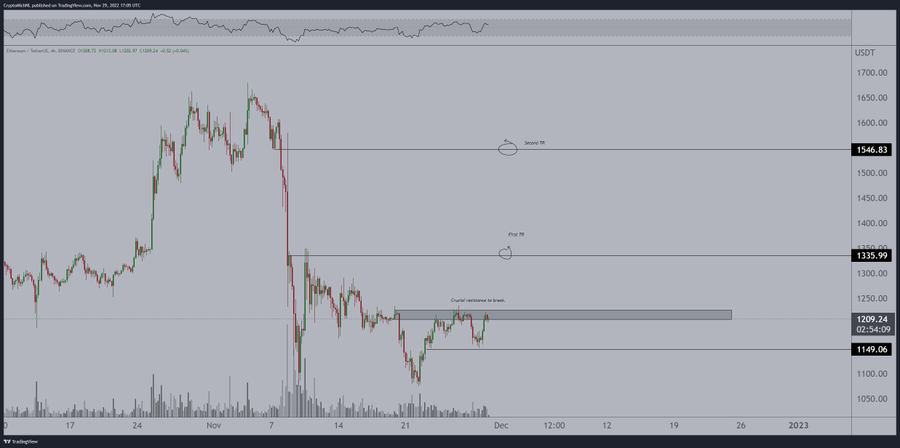
Indeed, provided that Ethereum retains its current strength, flipping the crucial level at $1,150 and breaking out above $1,225, it will pave the way for a bullish run towards $1,350 and possibly even $1,550, as observed by the crypto trading expert Michaël van de Poppe on November 29.
Increased user activity
Likely factoring into the recent price surge, Ethereum’s active addresses have surpassed a six-week high, last reached on October 15, which was followed by a 30% price hike over the following three weeks, according to the on-chain analytics platform Santiment.
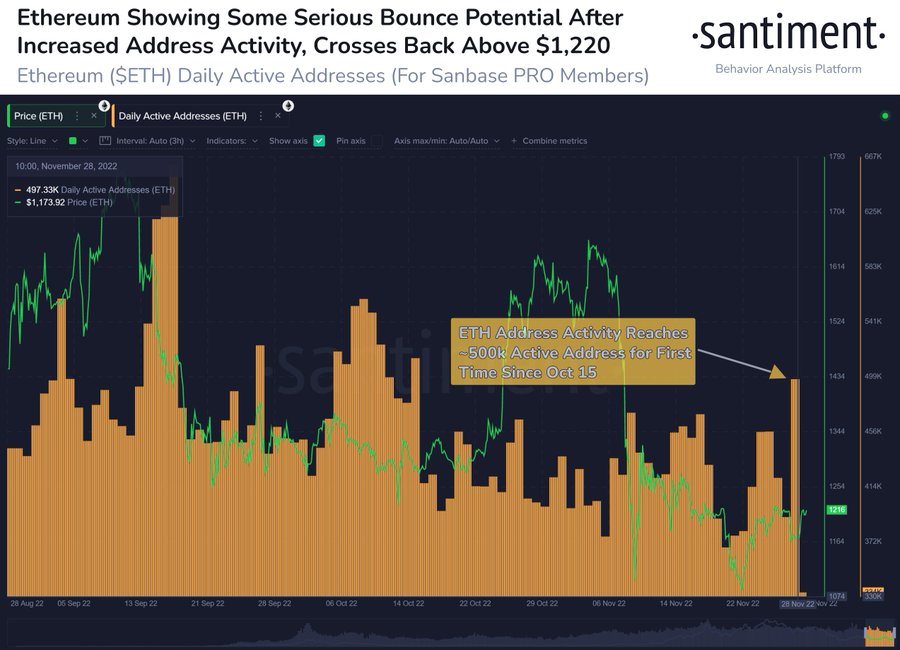
Along with the spike in price, Ethereum is also recording steady gains in large key addresses since early November, leading the number of shark and whale addresses (holding between 100 and 100,000 ETH) to a 20-month high, Santiment data shows.
Ethereum technical analysis
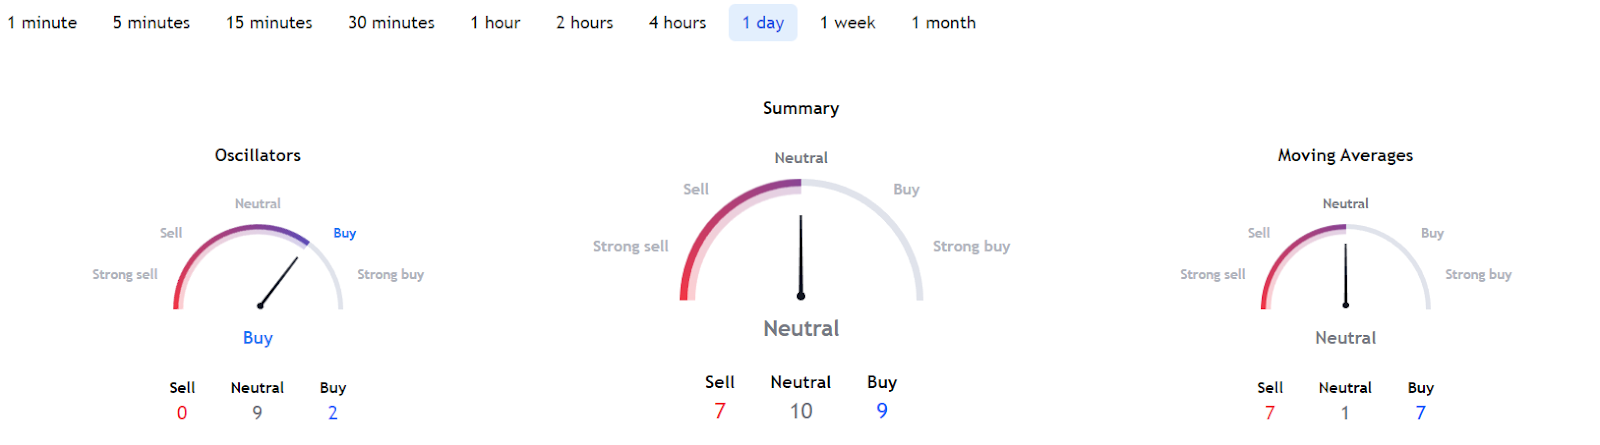
That said, Ethereum’s technical analysis (TA) indicators on 1-day gauges remain relatively undecided, as their summary stands in the ‘neutral’ position at 10, as opposed to 9 indicating ‘buy’ and 7 pointing towards ‘sell.’
This summary is taken from moving averages (MA), which are also firmly in ‘neutral’ at 1, whereas they equally suggest ‘buy’ and ‘sell’ at 7, respectively. On the other hand, oscillators are more optimistic, as they stand in the ‘buy’ zone at 2, as opposed to 9 in ‘neutral’ and no ‘sell’ indications.
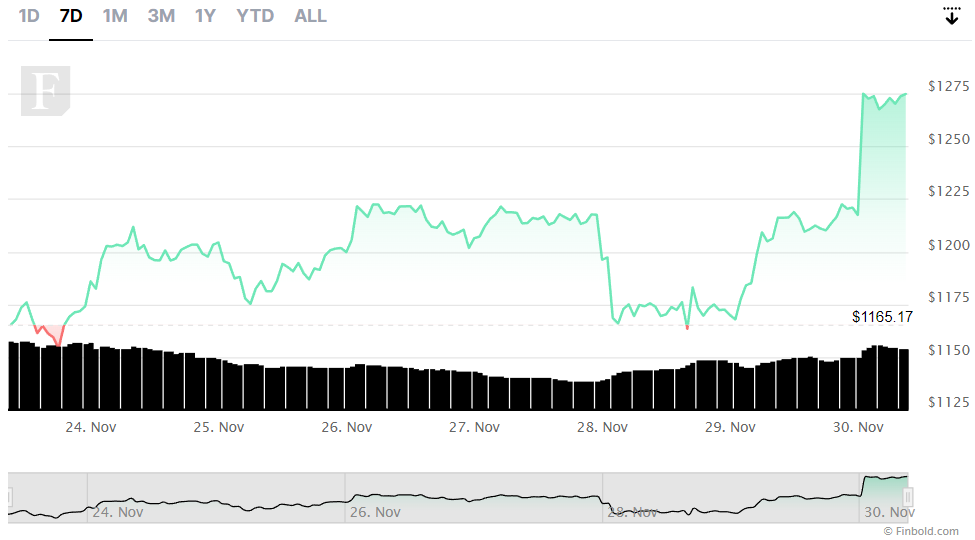
Meanwhile, Ethereum has already started its move in the direction Van de Poppe predicted, changing hands at the price of $1,265, which demonstrates an increase of 4.26% on the day and 8.51% across the previous week, minimizing the loss of 20.14% on its monthly chart.
On top of that, the cryptocurrency community over at CoinMarketCap has maintained its bullish attitude on the future of the decentralized finance (DeFi) asset, estimating it would trade at the average price of $1,413.61 by December 31, which fits Van de Poppe’s predictions.
Disclaimer: The content on this site should not be considered investment advice. Investing is speculative. When investing, your capital is at risk.