Tesla stock (NASDAQ: TSLA) is in a precarious position. To be more precise, it is, as of the time of writing, the second-worst performing stock in the entire S&P 500 index.
Numerous factors have contributed to this period of underperformance. January’s vehicle delivery figures marked the year-over-year (YoY) decline in the automaker’s history. In addition, company insiders dumped more than $44 million worth of Tesla stock in the first 10 days of the year alone.
Shortly after, the company’s latest earnings call, held on January 29, saw both earnings per share (EPS) and revenues come in below analyst estimates. Once we factor out the contribution of the company’s Bitcoin (BTC) investments the weakness in core operations is all the more stark.
At the same time, Elon Musk has become a highly-polarizing and controversial figure, both at his adopted home and abroad. The Tesla Takedown boycott movement is picking up steam — and the incidence of vandalism aimed at either Tesla dealerships or vehicles has increased.
Finbold’s research has also indicated that global interest in selling Tesla stock has reached a one-year high — and that Canada is leading the charge.
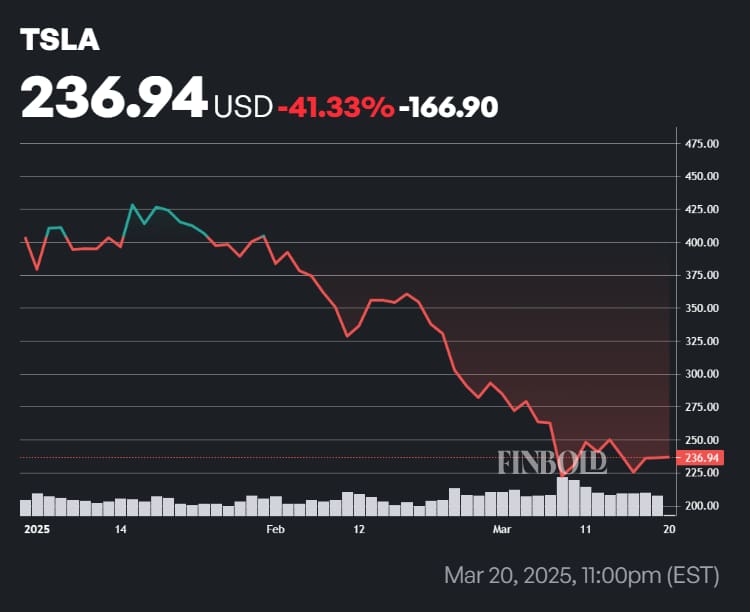
Lastly, TSLA shares have erased all of their post-election gains. On election day, November 5, TSLA stock closed at a price of $255.44.
By press time on March 21, it had erased all of its gains, and was changing hands at a price of $236.94. Year-to-date (YTD) losses stand at 41.33%.
Despite these challenges, numerous Wall Street analysts remain optimistic. Recently, a renowned technical analyst has outlined a case as to how Tesla stock could recover.
Technical analyst reveals thesis for Tesla stock surge to $450
Back in late June of 2024, noted chart expert TradingShot outlined the appearance of an inverse head and shoulders chart pattern.
Drawing a parallel between price action at the time and during the 2014 to 2016 period, by utilizing Fibonacci retracement levels, which are used to identify key price levels based on previous price action TradingShot set a minimum price target of $400, with a longer-term target at $700 per Tesla share.
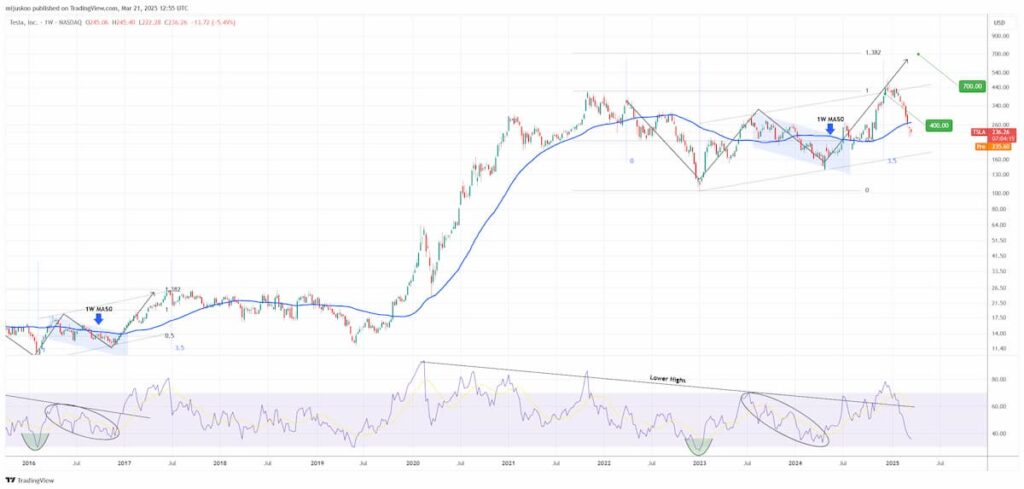
The more ambitious price target, corresponding to the 1.382 Fibonacci extension, was not reached.
However, the researcher posted an update through a March 21 TradingView post. Per the analyst, the 1-week relative strength index (RSI) of TSLA is showing similarities to movements seen in October of 2017. Last time around, this marked a bottom and ignited a rally.
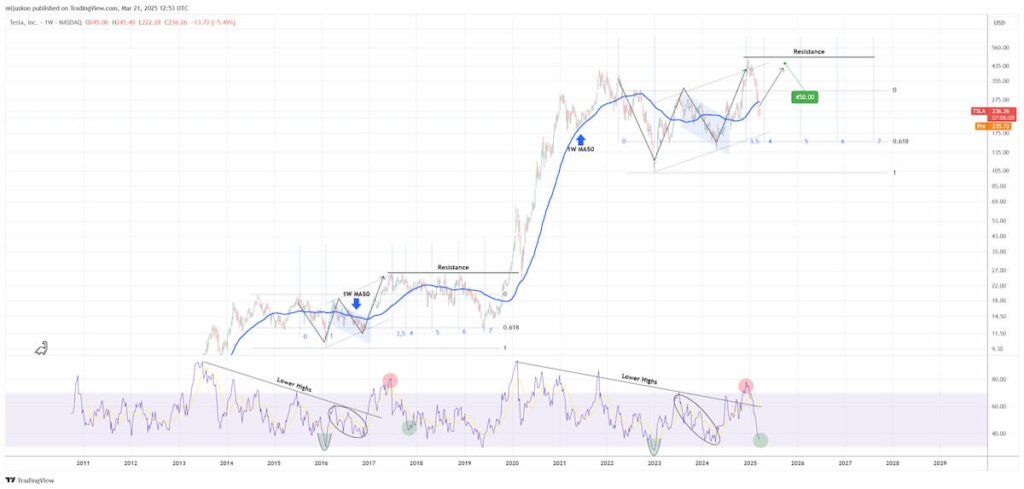
At present, Tesla’s long-term resistance is marked by its all-time high (ATH) price of $462.9 — and the technical analyst believes that a rebound is likely. Therefore, he has set a $450 price target for Tesla stock.
Featured image via Shutterstock