
Lucid Motors’ (NASDAQ: LCID) stock has been locked in a tight trading range for the past few weeks, stubbornly resisting any attempts to break above the elusive $6 mark since early September.
This stagnant performance follows a sharp decline in the electric vehicle (EV) manufacturer’s shares, reflecting waning investor confidence fueled by disappointing earnings and delivery reports in previous quarters.
Adding to the uncertainty, the delayed release of Lucid’s Q3 delivery figures, anticipated by analysts last week, has only heightened concerns.
Nevertheless, amid this lackluster trend, a noteworthy chart pattern has emerged, potentially signaling “a large move coming,” a prominent stock market analyst pointed out on October 17.
A wild falling wedge appears
According to a widely-followed trader and analyst Jake Wujastyk, shares of Lucid are moving in an increasingly tight trading range.
Judging from the image Wujastyk shared, it appears that LCID’s price action is forming a familiar chart pattern known as the “falling wedge.”
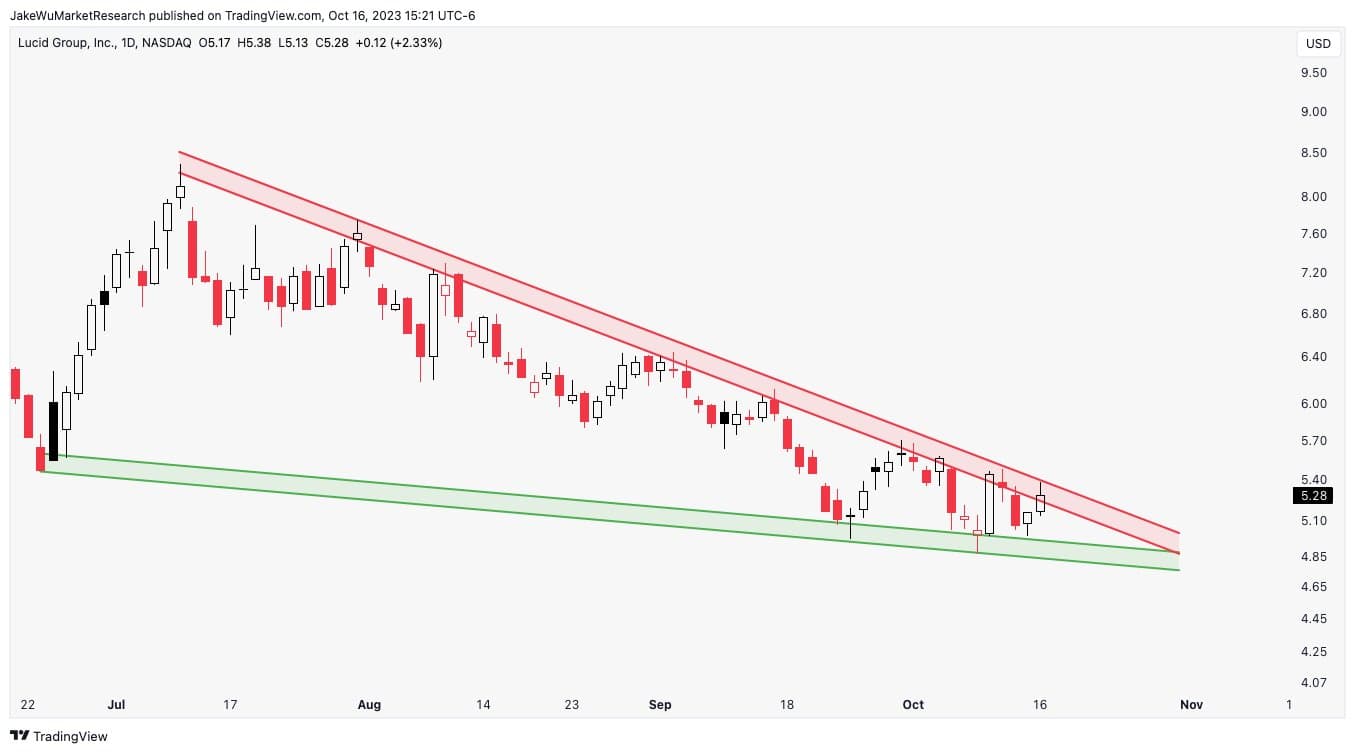
When asked in the comment section if a tight trading range in this pattern is ‘good,’ the analyst replied, “generally signals a large move coming.”
What does a falling wedge generally suggest?
Typically forming during a downward price trend, a falling wedge is a technical chart formation often considered a bullish reversal pattern.
In other words, it is a pattern that may signal a potential shift from a downtrend to an uptrend. The narrowing of the price range suggests that selling pressure is weakening, and buyers are gradually gaining control.
Traders often look for a breakout above the upper trendline of the falling wedge as a confirmation of the pattern. Notably, this breakout is a key moment, indicating that the price may reverse its downtrend and start an upward movement.
Further, it is also important to pay attention to trading volume. This is because an increase in trading volume as the price breaks out of the wedge can provide additional confirmation of the pattern’s validity and the potential for a sustained bullish move.
It is crucial to remember that no chart pattern is infallible, and that’s why use this formation in conjunction with other indicators, but also be prepared for the possibility that the pattern may not play out as expected.
Buy stocks now with Interactive Brokers – the most advanced investment platform
Disclaimer: The content on this site should not be considered investment advice. Investing is speculative. When investing, your capital is at risk.