
After reaching one of their highest 2023 points in mid-July, Lucid‘s shares (NASDAQ: LCID) have undergone a significant downturn, resulting in the loss of a substantial portion of their earlier gains.
This unexpected decline has raised questions among investors about the factors influencing the electric vehicle (EV) maker’s stock market performance in the current market landscape.
In particular, LCID’s stock price declined by almost 17% in August, plummeting from $7.47 on August 1 to $6.33 on August 30. During this slump, LCID’s market cap fell to $14.45 billion, from nearly $17 billion at the end of July.
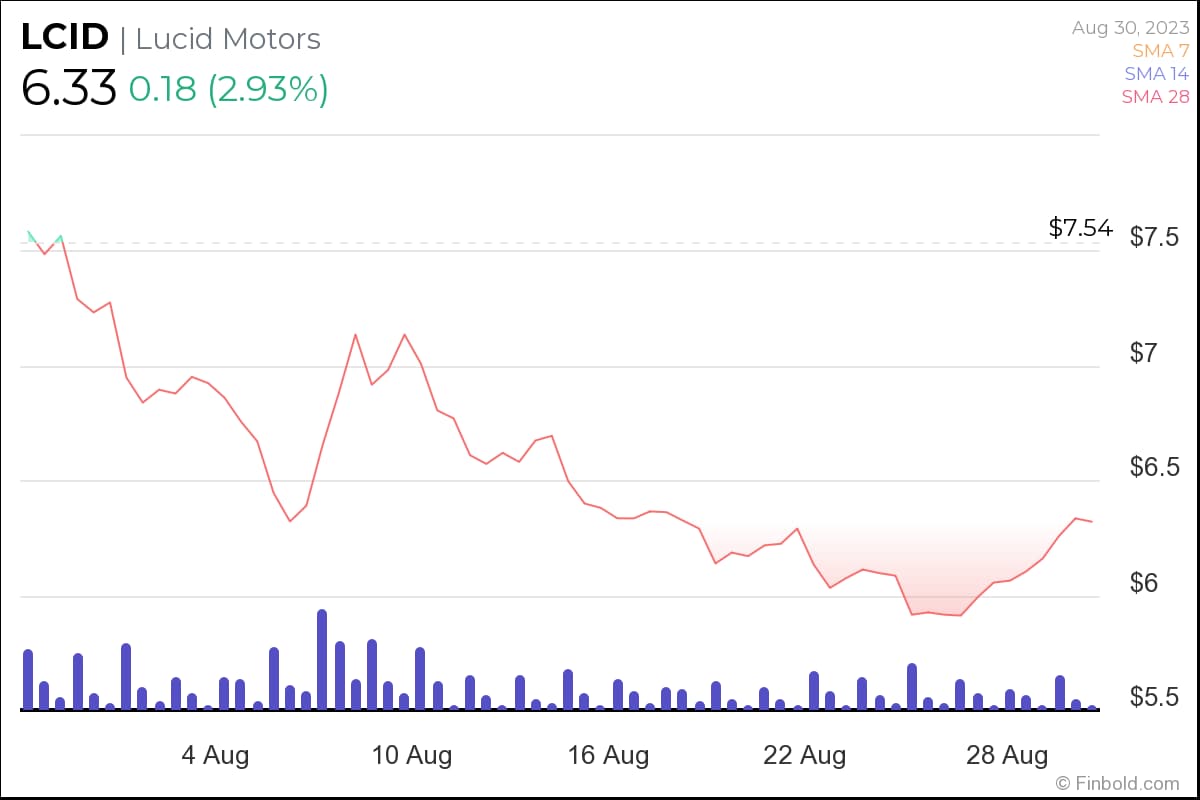
In the past 24 hours, Lucid’s shares climbed by over 2.9%, and more than 1.3% on the week. Year-to-date, however, the company’s stock remains in the red by more than 9%.
Why is Lucid stock declining?
Earlier this month, Lucid announced a significant price cut for some of its flagship EV models.
The move came in response to an EV price war started by industry leader Tesla (NASDAQ: TSLA), which slashed prices of its cars several times this year.
However, in contrast to TSLA, Lucid saw a noteworthy share price drop in the aftermath of price reductions. The slump suggests that investors wanted to see positive performance and results from Lucid, apart from a simple follow-the-herd move.
And that’s exactly where Lucid has been struggling. Notably, the company’s Q2 update showed its prediction declined considerably from the previous quarter, while deliveries remained flat.
The EV startup has been facing difficulties in ramping up production amid a string of supply chain headwinds, which have gotten even worse after Tesla sparked the price war.
What’s next for LCID stock?
After a sell-off that dominated the majority of the month of August, the price action has managed to recover in recent days. More concretely, the price action has been trapped within a falling wedge pattern.
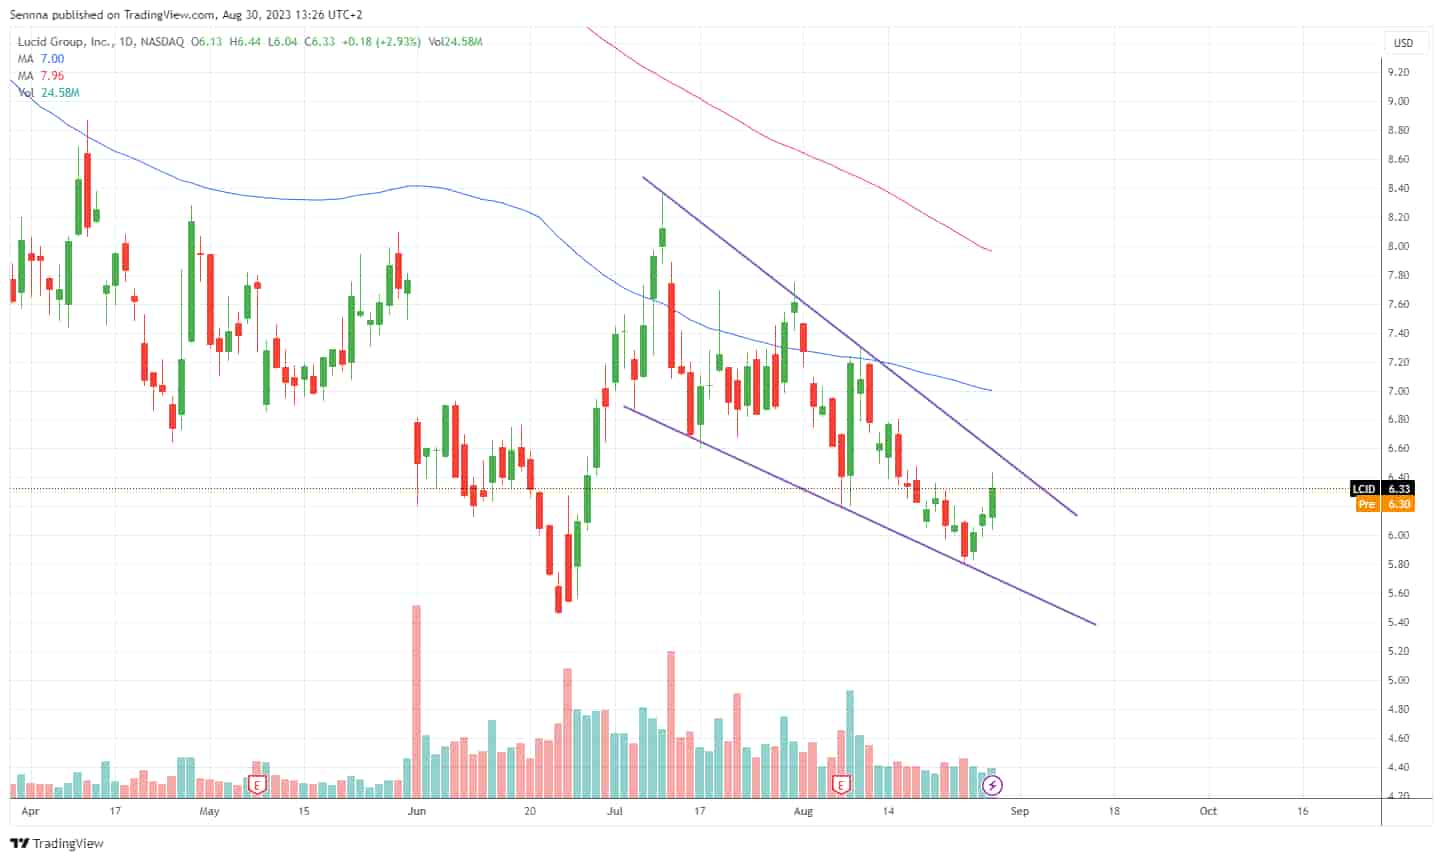
A break above the $6.50-$6.70 resistance zone would allow LCID stock to continue moving higher toward the next resistance e.g. the 100-day moving average (DMA) that comes in at $7.00, while the 200-day moving average comes in just below the $8 mark.
These two technical indicators will continue to act as strong resistance levels in September.
Buy stocks now with Interactive Brokers – the most advanced investment platform
Disclaimer: The content on this site should not be considered investment advice. Investing is speculative. When investing, your capital is at risk.