
The meteoric rise of Nvidia (NASDAQ: NVDA) stock has regularly raised questions about the sustainability of its rally, with concerns that it might be in a bubble following the company’s capitalization on the artificial intelligence (AI) boom.
In this context, the stock has drawn comparisons to the 2000 Dot-com bubble burst, with Nvidia being likened to another technology giant, Cisco (NASDAQ: CSCO).
Notably, a stock trading expert who goes by the pseudonym Kpak has offered an analysis of what investors can learn from the Cisco bubble top and Nvidia’s current trajectory.
In the analysis shared on X on August 18, the expert provided a retrospective look at Cisco’s performance before and after the dot-com bubble. The parallels between Cisco’s rise and Nvidia’s current trajectory are striking.
“Many people compare $CSCO’s rise in 2000 bubble top to $NVDA current move. Could we have anticipated $CSCO’s demise back then? Best way is to go back and chart and see how you could have seen the warning signs,” the expert said.
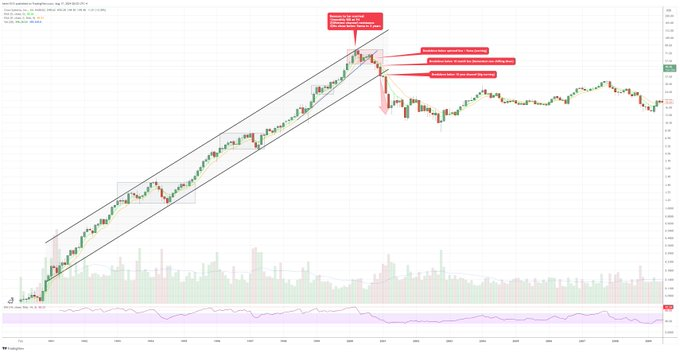
Cisco’s price movement during the Dot-com bubble
Cisco’s stock price shot up dramatically in early 2000, far exceeding its established upward trend channel. This level of overextension, driven by the irrational exuberance of the time, was a clear precursor of the correction that followed. When stocks surge far beyond their trendlines, they often revert to the mean, leading to substantial pullbacks.
At the same time, the analyst observed a significant bearish divergence. The stock price continued to rise, but key technical indicators, such as the Relative Strength Index (RSI), began to decline. This divergence signaled the upward momentum weakening, even as the stock price reached new highs. The warning signs were there for those who were observing, but in the fervor of the moment, they were easily overlooked.
Additionally, Cisco’s rise during the late 1990s into 2000 became increasingly steep, reflecting a parabolic trend. Such steep rises are often driven by speculative fervor and are typically unsustainable.
Eventually, Cisco broke down from its support levels, confirming the end of the bullish trend. This breakdown and a massive volume spike indicated that investors were rushing for the exits, leading to a rapid price decline.
Lessons for NVDA
As Nvidia’s stock continues to soar, driven by strong demand in the AI and GPU markets, many investors question whether the stock’s current valuation is justified. The parallels to Cisco’s 2000 peak are hard to ignore.
Notably, Nvidia, much like Cisco in 2000, is trading well above its long-term trend. This overextension raises concerns about the sustainability of its current price levels. Similar to the bearish divergence observed in Cisco’s RSI in 2000, Nvidia’s current technical indicators might also be flashing warning signs. If Nvidia’s price continues to rise while indicators like RSI weaken, it could suggest that the stock is running out of steam.
Nvidia’s recent price action has been steep, reflecting a parabolic trend similar to Cisco’s in 2000. While Nvidia’s growth story is compelling, parabolic rises often precede significant corrections.
The key takeaway from Cisco’s dot-com bubble experience is that no stock can defy gravity forever, no matter how promising its fundamentals are. Nvidia’s current rise has been extraordinary, but investors should be cautious and watch for signs of a potential correction.
NVDA price analysis
As things stand, Nvidia recently experienced high volatility, with the stock plunging below $90. However, the equity has reestablished itself above the $120 support zone, trading at $124 by the last market close.
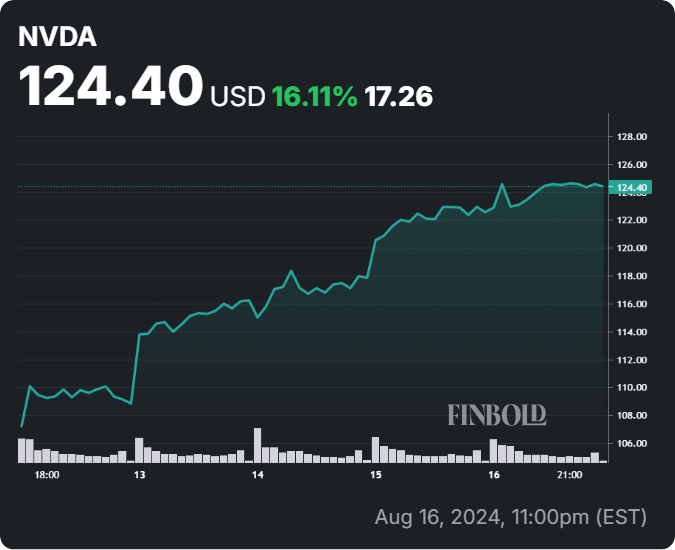
Overall, the stock is buoyed by bullish sentiments, especially with anticipated positive earnings results for Q2 2024.
Disclaimer: The content on this site should not be considered investment advice. Investing is speculative. When investing, your capital is at risk.