Although most assets on the cryptocurrency market continue to suffer heavy blows, sights are set for a bullish 2023, at least where Polygon (MATIC) is concerned, which has been following a price action of another major decentralized finance (DeFi) token.
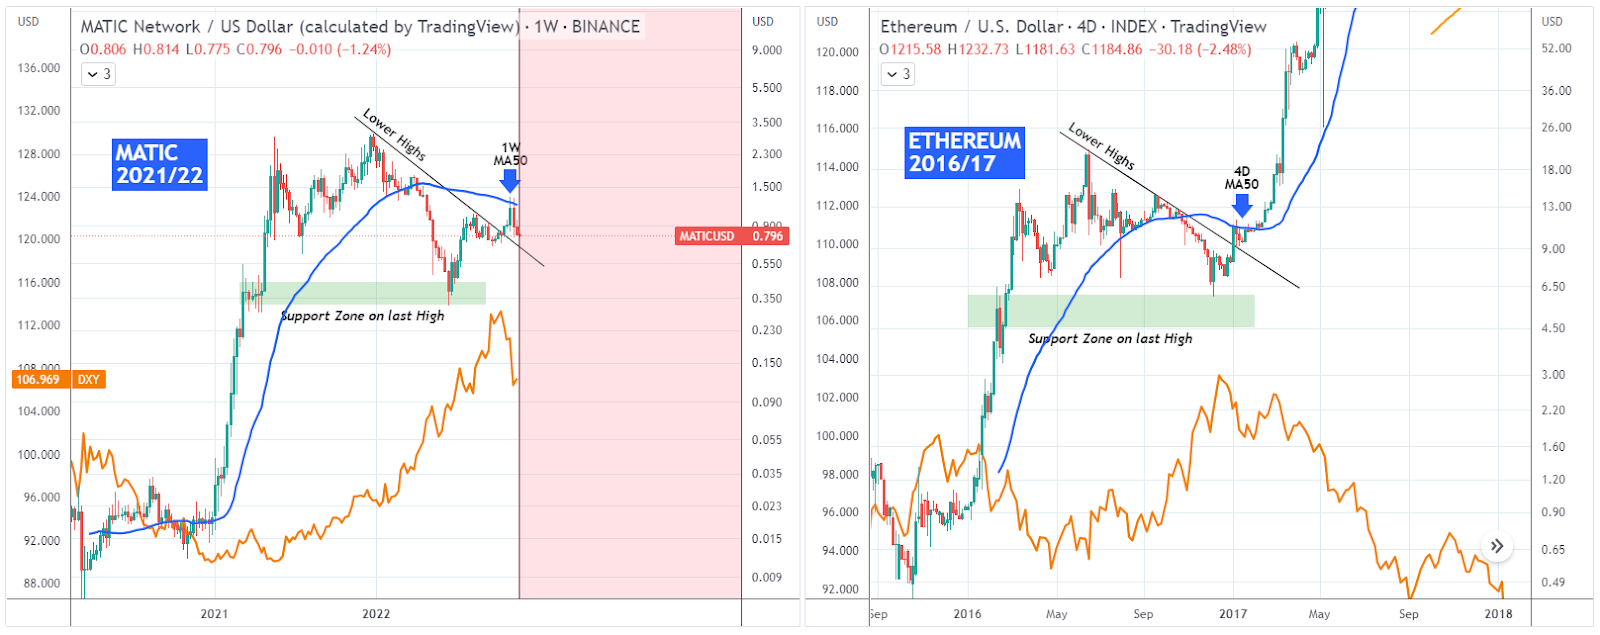
Specifically, after the COVID crash of March 2020, the price action of Polygon has so far mimicked the pattern that Ethereum (ETH) was making between October 2015 and January 2017, according to a side-by-side analysis by the experts at TradingShot published on November 20.
What are the similarities and what do they mean?
As the analysts explained, “the MATIC Network (MATICUSD) was rejected last week on the 1W MA50 [50-day moving average].” This imitates the behavior of Ethereum, “which also got rejected on its MA50,” as “both made the MA50 rejection after they broke above their correction Lower Highs trend-line.”
Furthermore, the U.S. Dollar played a big part in the break-outs of both cryptos on the observed timelines:
“What made a big difference for ETH in its January 2017 break-out and rally was the bearish reversal on the U.S. Dollar (DXY). MATIC made its October 2022 bullish break-out as the DXY has pulled back significantly.”
In the view of TradingShot experts, “if the fractal continues to be repeated, expect a strong rally on MATIC in 2023.”
MATIC price analysis
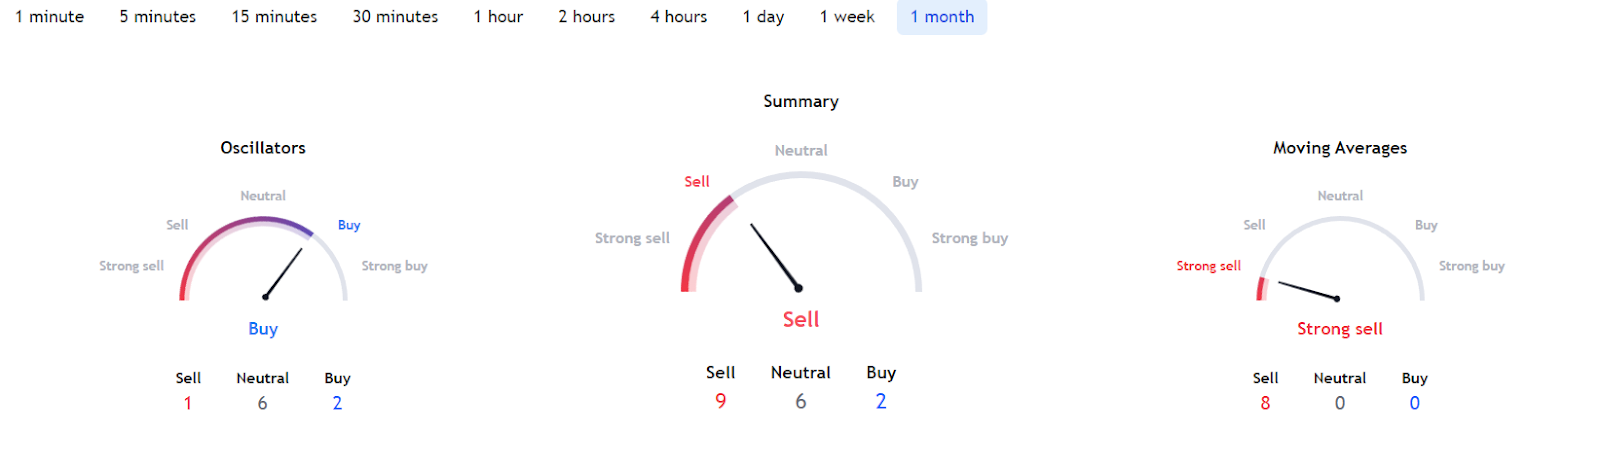
Meanwhile, Polygon’s technical analysis (TA) on the 1-month gauges is in the ‘sell’ zone at 9, as opposed to ‘buy’ at 2 and ‘neutral’ at 6. This summary is the result of MAs indicating a ‘strong sell’ at 8 and oscillators in the ‘buy’ area at 2.
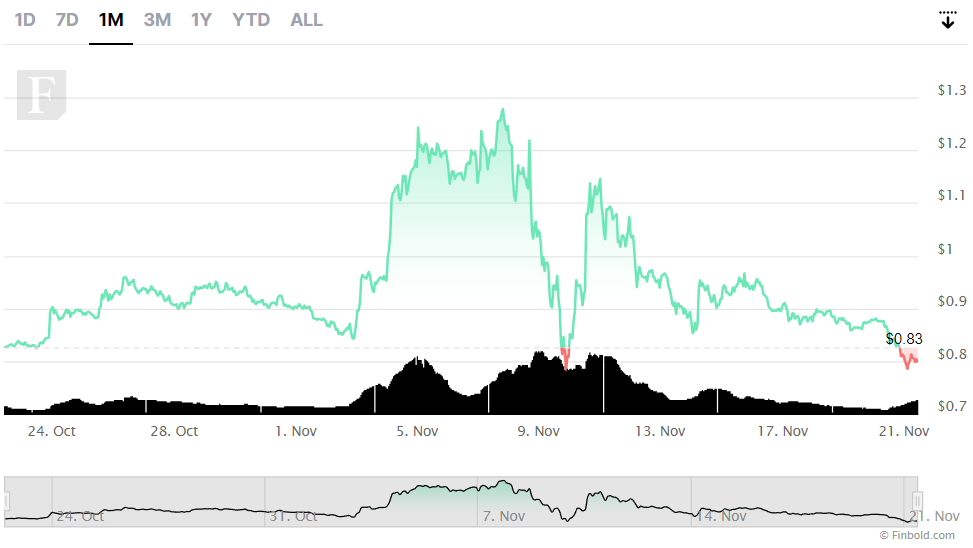
At press time, MATIC was changing hands at the price of $0.8042, down 6.55% over the previous 24 hours and 14.16% across the week, contributing to the cumulative loss of 2.65% on the monthly chart.
Since the year’s turn, the 10th-largest token by market capitalization ($7.02 billion) has been keeping up with the larger market sentiment along with Ethereum, as they both took a massive hit during the recent FTX-induced crisis.
Disclaimer: The content on this site should not be considered investment advice. Investing is speculative. When investing, your capital is at risk.