
While most cryptocurrencies turned drastically bearish this week amid geopolitical tensions following the Iranian offensive against Israel, two projects remain with an overbought Relative Strength Index (RSI), making for a potential sell signal.
The cryptocurrency market has been dipping since April 12 due to the escalation of the Iran-Israel war and macroeconomic uncertainties. Notably, the average weekly RSI indicator for all cryptocurrencies dropped below the neutral-50, evidencing the overall loss of momentum.
In the meantime, some projects have maintained a strong RSI indicator, showing uncorrelation with the general market. Thus, it suggests that these assets are either backed by solid demand and may hold this momentum longer or are laggards, waiting for further correlation.
Picks for you
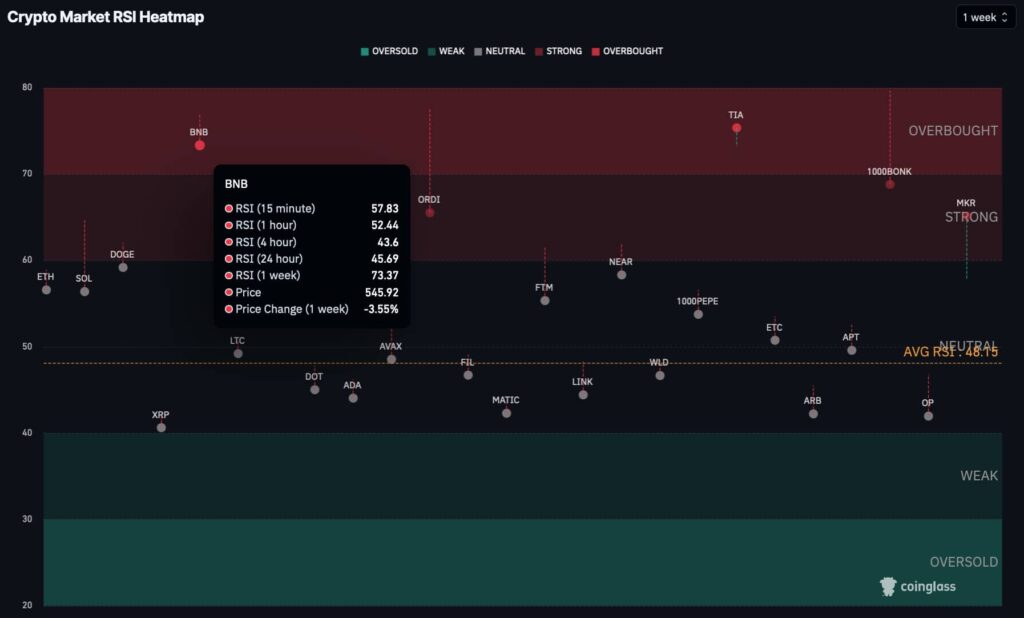
Finbold gathered data from CoinGlass and TradingView on April 17, looking for potential overbought sell signals.
Sell signal to BNB Chain (BNB)
In particular, the BNB Chain (BNB) token remains overbought in the weekly chart, marking a 73.37 RSI. This far-above-the-average indicator results from no more than 3.55% losses in the last seven days.
However, despite a considerably strong weekly performance, BNB has a 45.69 neutral RSI in the daily chart.
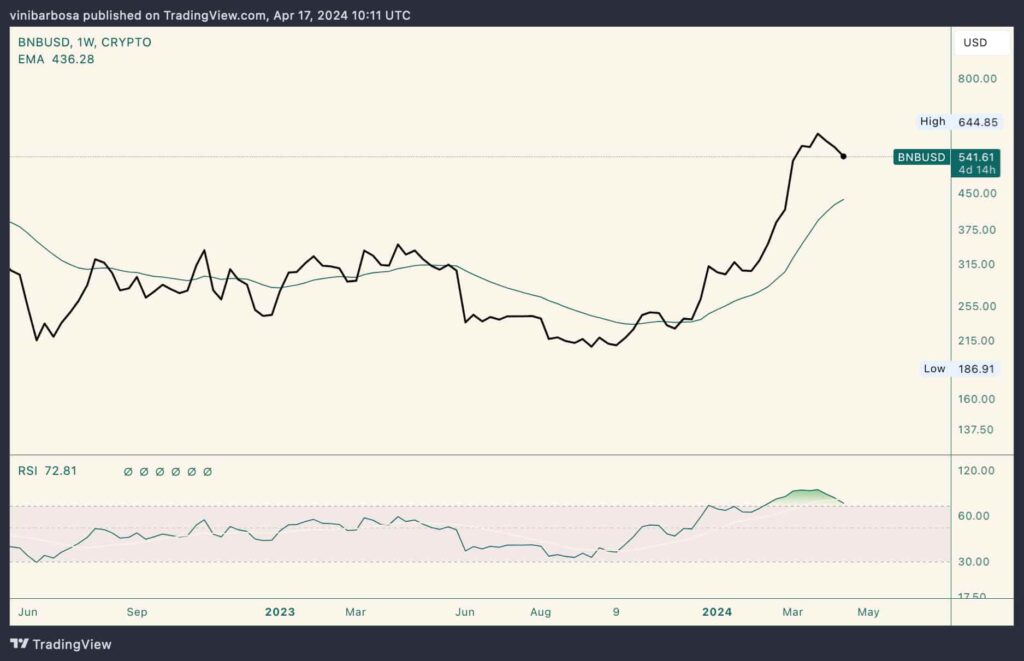
The short-term neutral RSI usually anticipates a more aggressive move, either upward or downward, after a brief consolidation period. Therefore, looking at BNB’s 20-week exponential moving average (EMA) may provide insight into which direction it can potentially follow.
On that note, the 20-EMA suggests around $436 per token for key support. This is over $100 lower than BNB’s price of $541 by press time. Validating what could be a sell signal for the overbought BNB Chain native token.
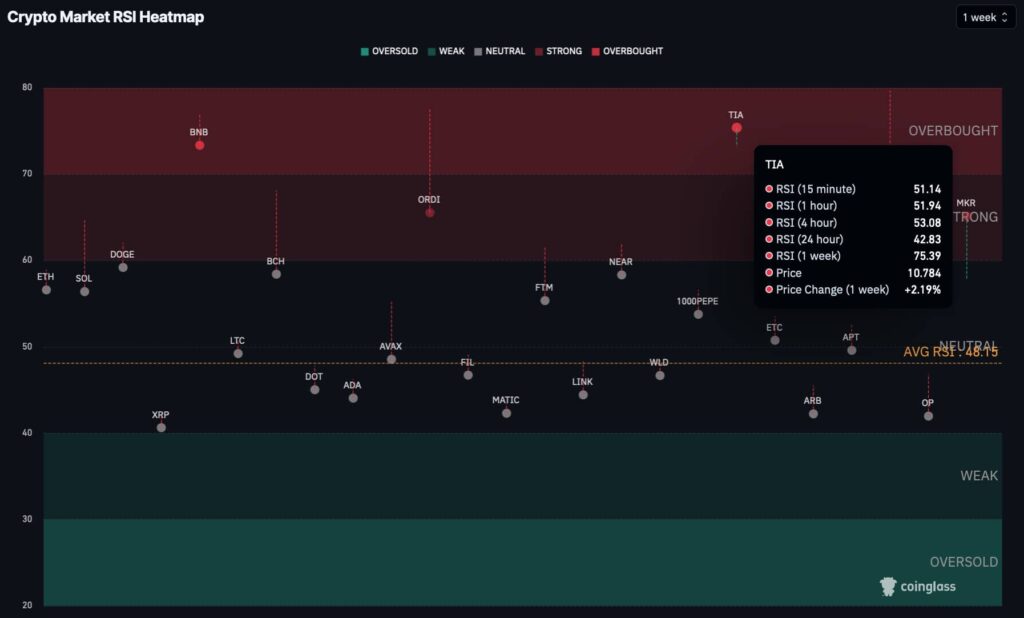
Overbought Celestia (TIA)
Similarly, Celestia (TIA) also remains overbought in a weak market, as measured by the weekly Relative Strength Index. The seven-day chart indicates a 75.39 RSI, while TIA trades at $10.78, with 2.19% in weekly gains.
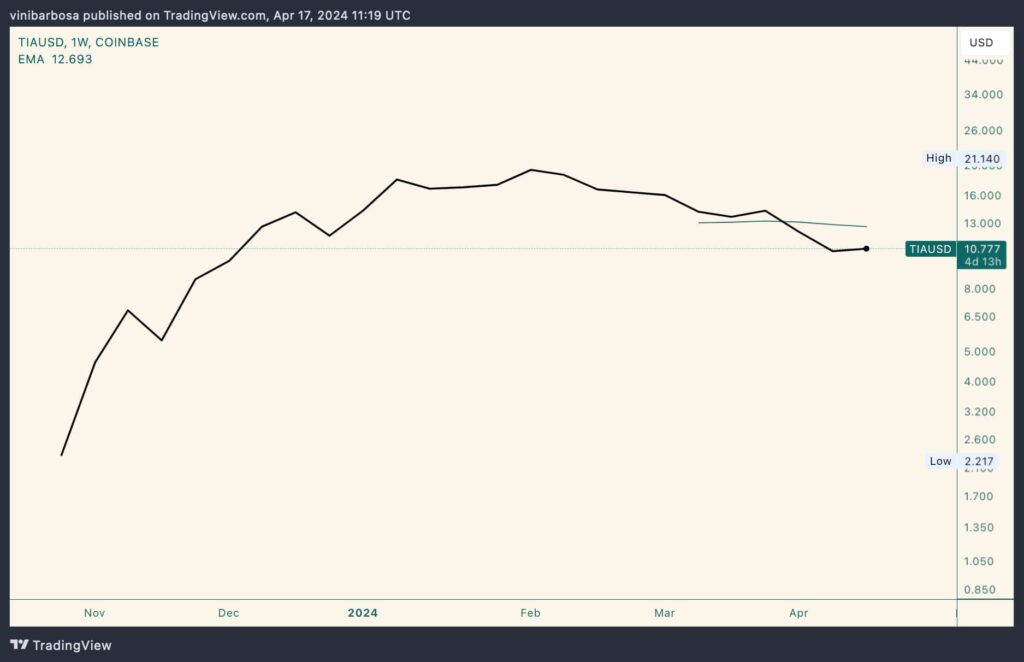
On the other hand, TIA trades below Celestia’s short-life 20-EMA, validating an overbought cryptocurrency that could soon visit lower levels. This exponential moving average draws potential resistance at $12.69.
Despite the aforementioned indicators, a solid sell signal is usually the result of deep and thoughtful research considering multiple factors. Cryptocurrency traders and investors must understand that the market is uncertain and that things can change in the blink of an eye.
Disclaimer: The content on this site should not be considered investment advice. Investing is speculative. When investing, your capital is at risk.