While many cryptocurrencies like Bitcoin (BTC) and Ethereum (ETH) have been carefully testing new resistance levels throughout the current market rally, Solana (SOL) has been on a remarkable, almost unbroken, upward trend.
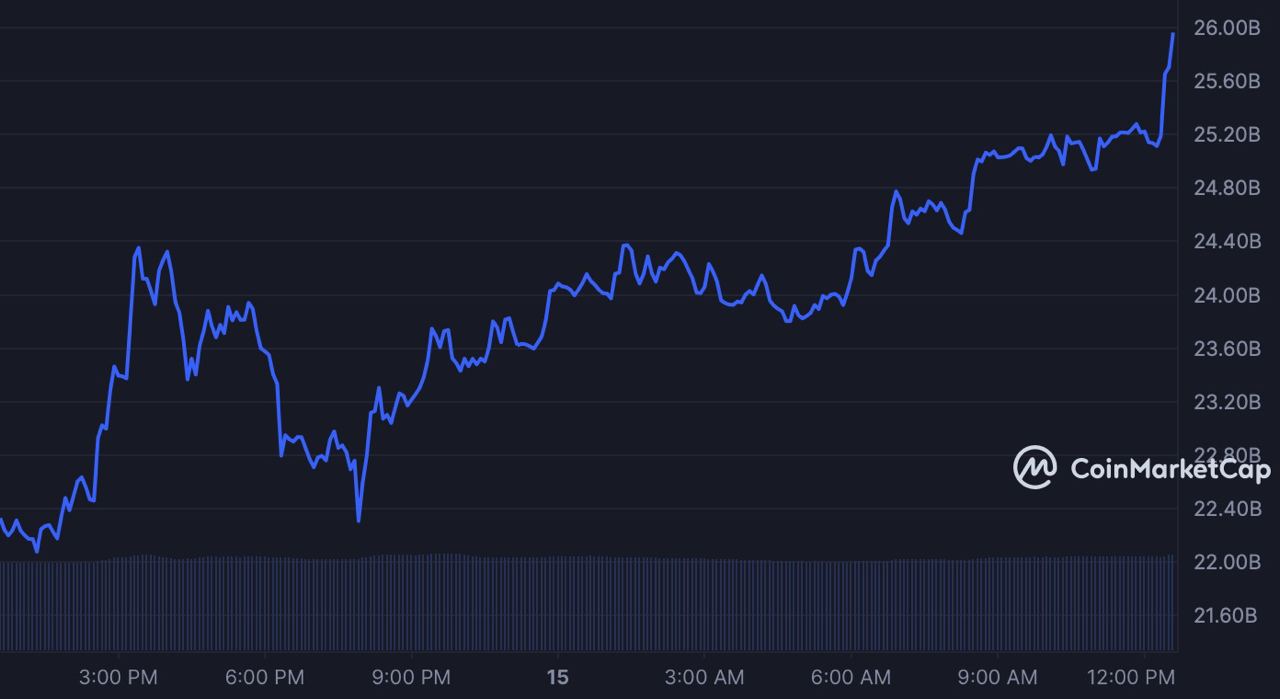
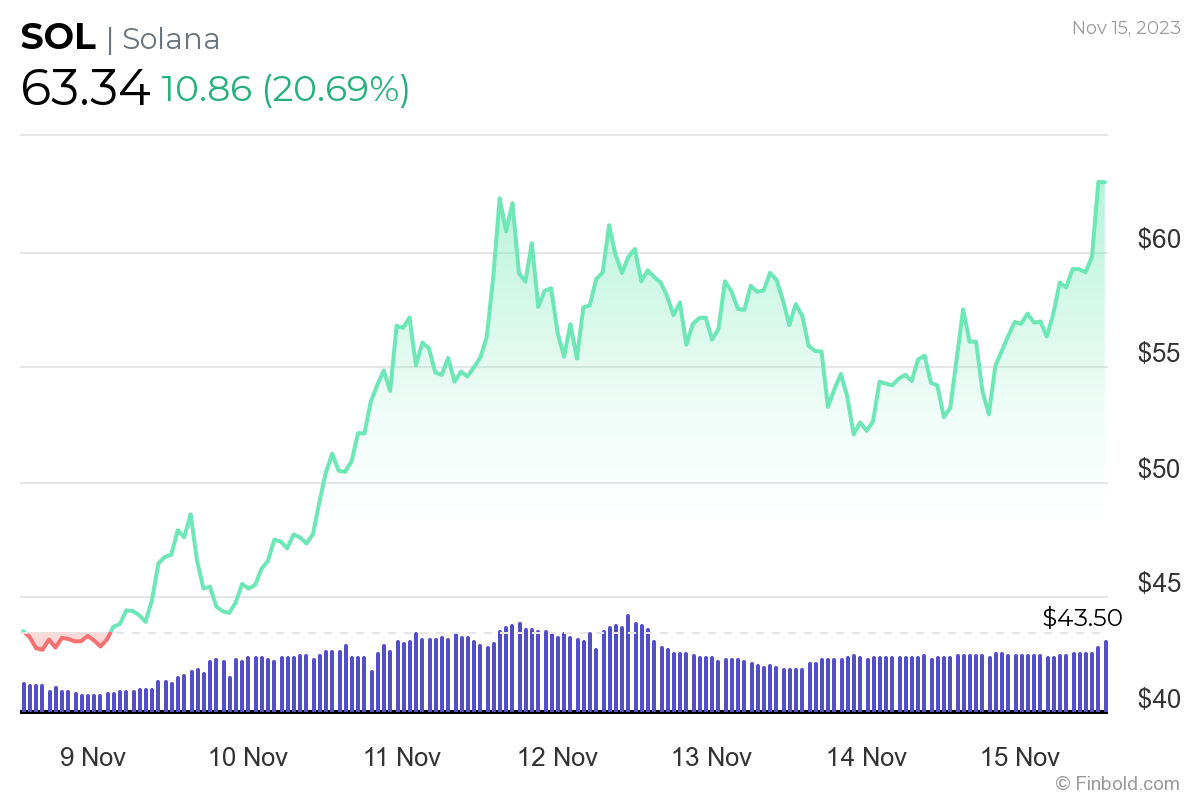
In the last 24 hours alone, the token added $4 billion to its market cap, going from approximately $22 billion to $26.5 billion in a massive surge, as per data retrieved by Finbold from Coinmarketcap on November 15. Its price followed suit and rose by 20.69% in a day – up to $63.34.
Zooming out, SOL has been surging throughout the previous month, rising nearly 190% percent since mid-October. It has also been growing steadily in the past week, having risen 46,31% from the price of $43 it held last Wednesday.
Indeed, the cryptocurrency has advanced to the sixth position in terms of market cap through the current rally and has, so far, successfully shrugged off downward pressure stemming both from the ongoing offloading of FTX’s assets and from investors and traders trying to take profit.
Can SOL reach $70?
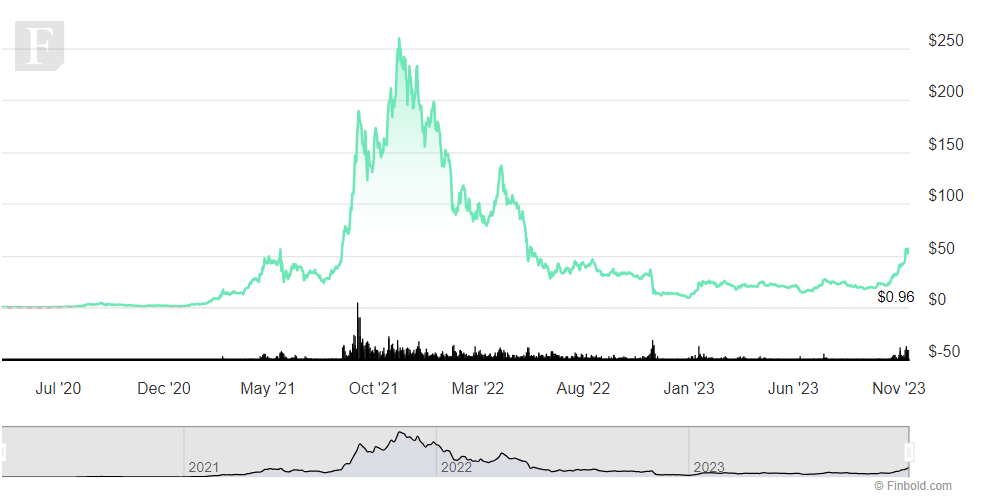
The continuous surge in Solana’s price hits toward a real possibility that the token might soon reach $70 – a price not seen since late 2022. The upward momentum has also been bolstered by certain industry news, such as the launch of SOL perpetual futures trading announced by Coinbase (NASDAQ: COIN) on Monday, November 13.
Despite the enthusiasm and the buy signals pertaining to the cryptocurrency, it is noteworthy that it has already attempted to break toward $64 late last week, only to retrace and consolidate near $55 for a few days.
Additionally, its recent pattern is similar to the one seen in April and May 2021 when it retraced to below $25 after testing both $53 and $61. Still, it is noteworthy that the token has been defying common technical analysis (TA) indicators throughout the rally, as they have been indicating possible correction for several weeks.
Finally, even if SOL follows its 2021 pattern to some degree, it isn’t out of the question that its price could subsequently explode to new all-time highs as it did two years ago.
Disclaimer: The content on this site should not be considered investment advice. Investing is speculative. When investing, your capital is at risk.