
As the benchmark S&P 500 (SPX) battles increased volatility, technical indicators suggest the index might be on the verge of a bullish run in the coming weeks, with resistance remaining at the 6,000 mark.
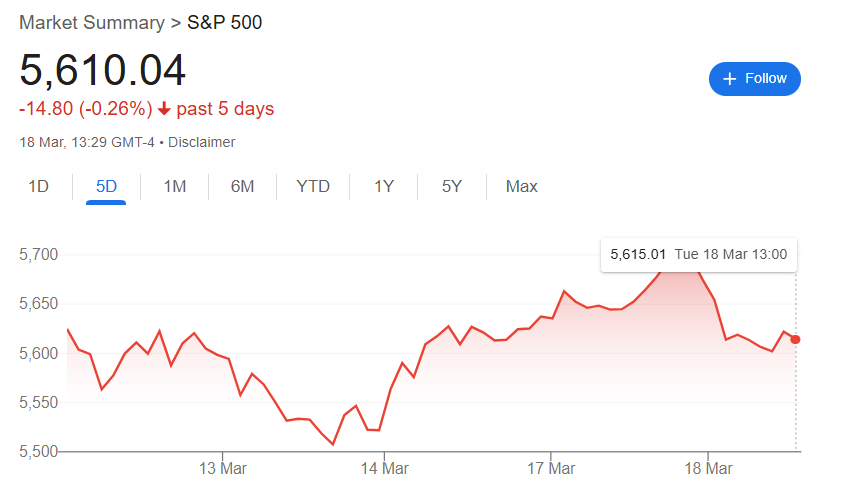
At press time, the index stood at 5,608, down 1.1% for the day. On the weekly timeframe, it has corrected by a modest 0.30%.
S&P 500 turns bullish
Regarding its next movement, prominent online trading expert TradingShot noted that the S&P 500 has officially confirmed a bullish breakout after surging above its one-month descending channel and reclaiming the four-hour 50-moving average (MA), he said in a TradingView post on March 18.
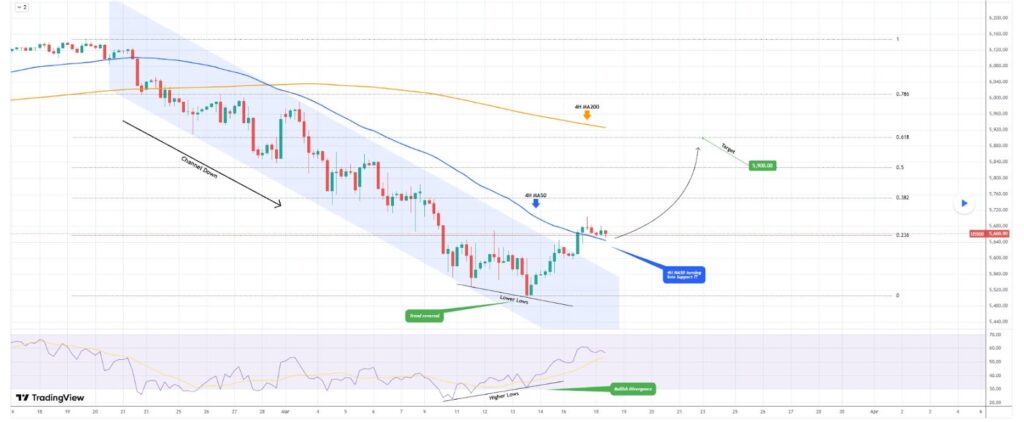
This key technical move signals a potential trend reversal, with the index now eyeing higher levels. According to the analyst, the first indication of this shift came from the four-hour relative strength index (RSI), which formed higher lows while the price made lower lows on March 13—a bullish divergence.
Historically, trends indicate that this pattern often precedes a trend reversal, and the SPX has followed through, breaking past prior resistance.
The index is consolidating above the 4H MA50 at 5,580, suggesting this level may now act as new support. If it holds, the next key resistance to watch is the four-hour 200-moving average (4H MA200), which coincides with the 0.618 Fibonacci retracement level at 5,860.
Given the breakout confirmation, technical projections suggest that the S&P 500 is poised for further upside, with the next target at 5,900.
Indeed, the index is flashing short-term growth potential, considering that at the close of the last trading session, more than 91% of its stocks were trading above their five-day moving average, the highest level since December 2023.
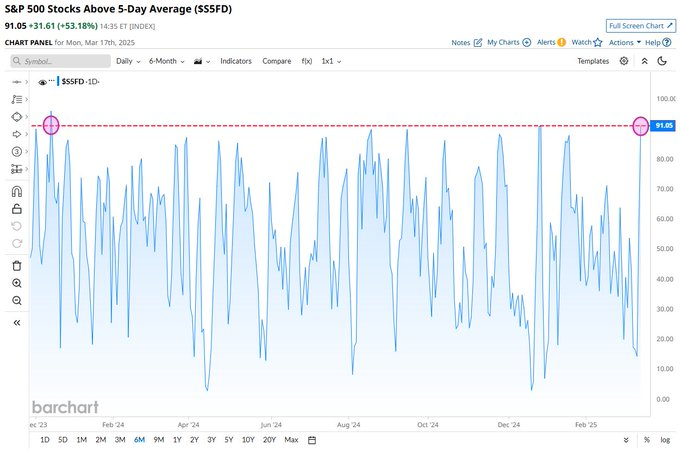
This surge in breadth suggests broad-based buying across the index, which can be viewed as a positive sign amid current market uncertainty triggered by President Donald Trump’s tariffs.
Historically, such high readings indicate strong bullish momentum in the near term. However, caution is warranted due to prevailing uncertainty and short-term bearishness, as the movement might lead to minor pullbacks or consolidation before the next leg is higher.
Wall Street’s S&P 500 projection
Despite the S&P 500’s technical indicators pointing to a possible rally, several analysts have issued varied outlooks for the index.
As reported by Finbold, economist and market strategist Ed Yardeni lowered his year-end 2025 target to 6,400 from 7,000, citing rising stagflation risks. His 2026 forecast also dropped to 7,200 from 8,000.
A key driver of Yardeni’s outlook shift is the impact of Trump-era tariffs, which he warns could exacerbate inflation and slow economic growth.
Goldman Sachs also lowered its S&P 500 target to 6,200, while Morgan Stanley’s Michael Wilson expects a possible drop to 5,500, with resistance at 6,100 due to policy uncertainties and earnings pressure.
Featured image via Shutterstock