After facing trials in 2022, Microsoft’s stock (NASDAQ: MSFT) has staged an impressive comeback this year, surging to an unprecedented peak of nearly $360 per share last month. The driving force behind this remarkable rally has been the ongoing surge in artificial intelligence (AI) space.
Microsoft’s deep-rooted involvement in AI technology has gained newfound vigor, propelled further by the groundbreaking achievements of ChatGPT. Notably, Microsoft’s substantial financial support for ChatGPT’s developer OpenAI has contributed significantly to this resurgence.
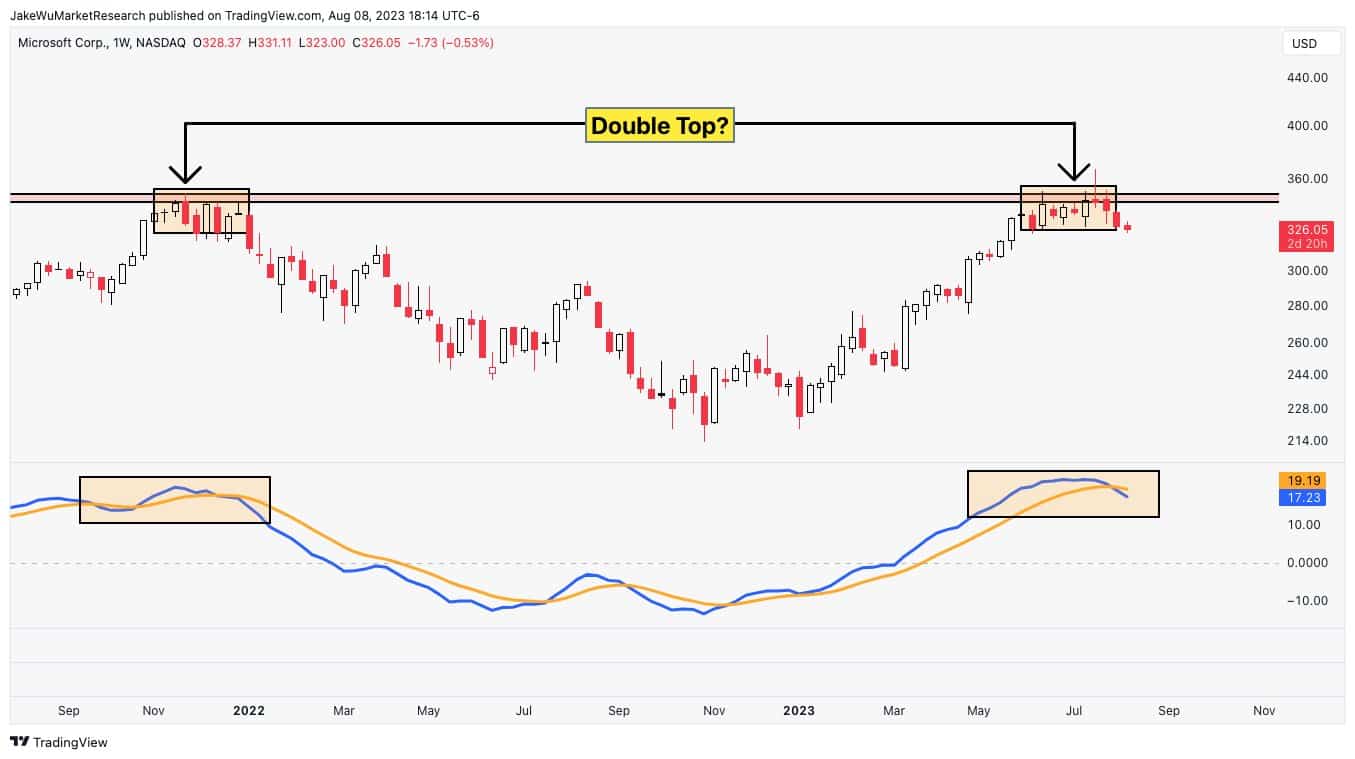
However, Microsoft’s stellar run may be at risk, as suggested by widely-followed market analyst Jake Wujastyk on Wednesday, August 9. Notably, after analyzing the company’s stock price action, Wujastyk revealed on Wednesday that MSFT may be forming a Double Top, which is deemed as an extremely bearish chart pattern.
What does Double Top signal?
A Double Top is a technical chart pattern commonly observed in financial markets. It forms after an uptrend and consists of two distinct peaks that reach approximately the same price level, separated by a trough – a temporary dip in price.
For that reason, the pattern is considered a reversal pattern, signaling a potential change in the prevailing trend from bullish to bearish.
Put simply, a Double Top can indicate a potential price slump because it suggests that the upward momentum has weakened and that buyers are struggling to push the price higher.
The second peak often marks a resistance level where selling pressure becomes significant, resulting in a rejection of higher prices, leading to a subsequent price decline as sentiment shifts, with traders anticipating a downward trend.
Nevertheless, it is essential to emphasize that in the context of MSFT, the potential Double Top pattern has not yet been validated as instances of such patterns sometimes result in false signals.
MSFT stock price analysis
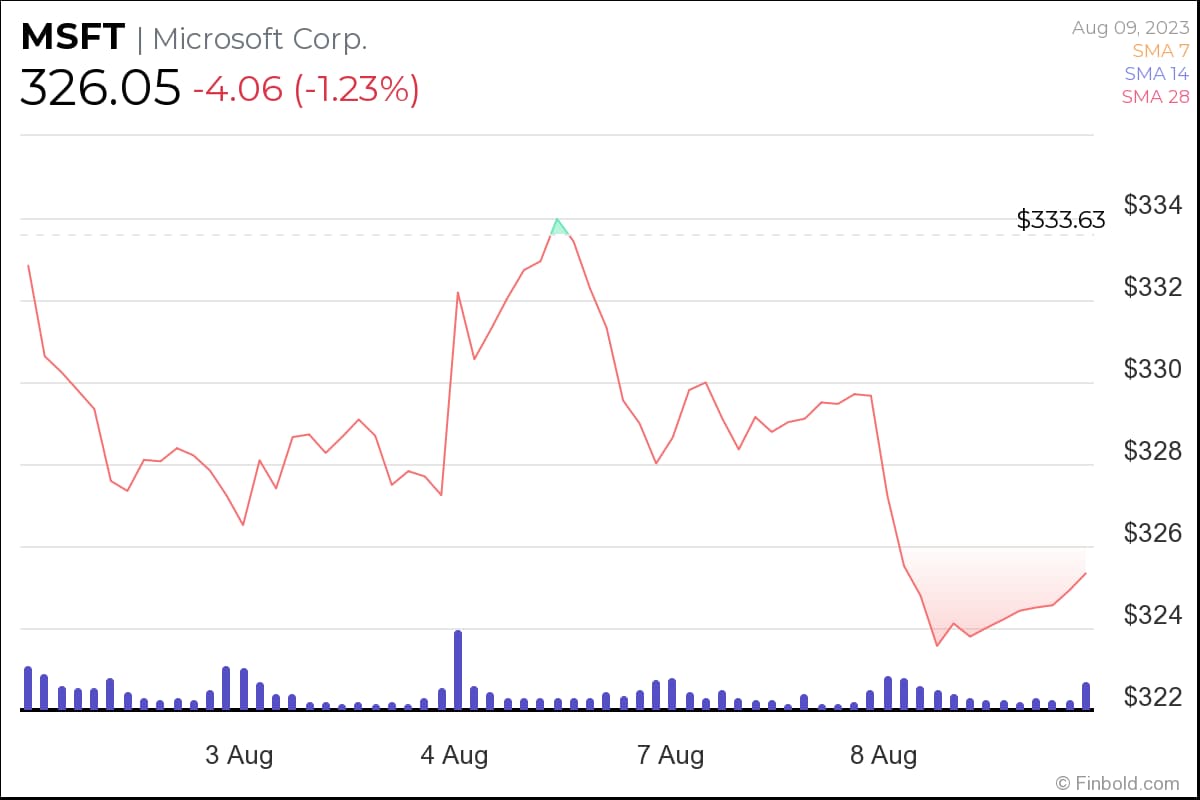
At the time of publication, shares of Microsoft were standing at $326.05, down 1.23% in the past 24 hours.
Over the past week, the tech giant’s shares fell over 2.7% and nearly 4% on the month.
Year-to-date, MSFT gained nearly 35%, propelling its market cap above $2.4 trillion on the back of the ongoing AI craze.
Clearly, Microsoft’s stock price has been pulling back after failing to close above the $350 mark.
For the double-top chart pattern to be activated, the price action must break the neckline (around $215), before one can trade this candlestick formation.
Without the break of the neckline, there is no Double Top pattern. In the meantime, the stock could continue to correct lower given the strong YTD rally.
Buy stocks now with Interactive Brokers – the most advanced investment platform
Disclaimer: The content on this site should not be considered investment advice. Investing is speculative. When investing, your capital is at risk.