
This guide provides a straightforward introduction to the double top pattern, how it forms on charts, and how to use it as part of your trading strategy. We’ll also cover the potential pros and cons of relying on this pattern.
Best Crypto Exchange for Intermediate Traders and Investors
-
Invest in cryptocurrencies and 3,000+ other assets including stocks and precious metals.
-
0% commission on stocks - buy in bulk or just a fraction from as little as $10. Other fees apply. For more information, visit etoro.com/trading/fees.
-
Copy top-performing traders in real time, automatically.
-
eToro USA is registered with FINRA for securities trading.
What is a double top pattern?
Double-top pattern definition
It is formed when the price of an asset reaches a peak two consecutive times with a moderate decline between the two. It is confirmed once the price falls below a support level equivalent to the low between the two previous peaks.
A double top pattern is a bearish price reversal that signals the end of a bullish market. A double top pattern is the opposite of a double bottom pattern, which suggests a bearish-to-bullish trend reversal and typically occurs at the end of a downward trending or declining market.
Recommended video: How to trade double tops and bottoms
What does a double top pattern look like?
A double-top chart pattern generally looks like the letter “M,” with two roughly equal peaks that occur after one another. The peaks include a moderate trough in-between.
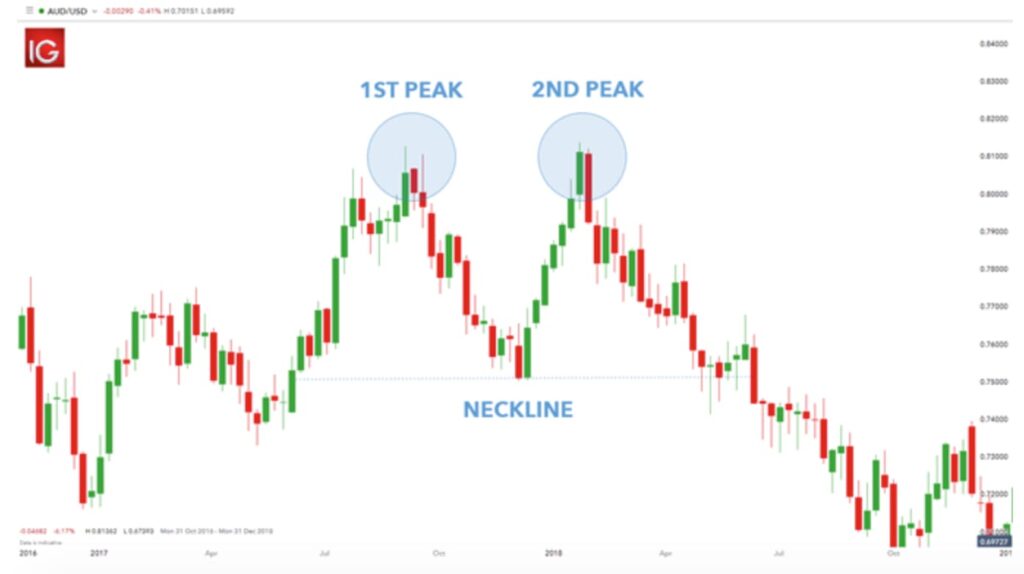
In particular, a double top pattern typically consists of these six elements:
- Prior Trend: Any reversal pattern must have an existing trend to reverse. In the case of the double top, a powerful uptrend of several months should be established;
- First peak: The first peak should denote the highest point of the prevailing trend. The first peak is relatively standard and is not an indication of a trend reversal at this moment;
- The valley: The two peaks are separated by a (10-20%) decline in price, known as the valley. The price level of this minimum is referred to as the neckline. Volume on the downturn from the first peak is typically inconsequential;
- Second peak: The second top usually occurs with low volume and will be slightly below the first peak indicating resistance and exhaustion. The pattern still needs to be confirmed at this point;
- A further descent from the peak: The subsequent drop from the second peak should witness increased volume, demonstrating that the sellers in the market are beginning to prevail, i.e., the supply is overtaking the demand;
- Pattern confirmation – breaking the support level: Forming the double top reversal is complete once the neckline (support level) is broken at its lowest point between two peaks. This, too, should occur with high volume or accelerated descent.
How to identify a double top pattern?
Now that we’ve established what a double-top pattern looks like, let’s see how to identify one.
Follow these steps to identify a double top pattern on a chart:
- Look for two distinct consecutive peaks on a chart with a similar height and width;
- The distance between the two peaks shouldn’t be too small, but this depends on your chosen trading time frame;
- Draw the neckline/support level;
- To confirm a double top pattern, use other technical indicators such as moving averages (MA), oscillators, or relative strength index (RSI);
- When the advances to the second peak, look for a decrease in volume as a further indication of weakening demand.
Best Crypto Exchange for Intermediate Traders and Investors
-
Invest in cryptocurrencies and 3,000+ other assets including stocks and precious metals.
-
0% commission on stocks - buy in bulk or just a fraction from as little as $10. Other fees apply. For more information, visit etoro.com/trading/fees.
-
Copy top-performing traders in real time, automatically.
-
eToro USA is registered with FINRA for securities trading.
How to trade double top patterns?
Once the double top pattern has been identified, you can look for potential shorting opportunities. There are two main ways to trade a double top pattern: either place an order to sell once the price breaks through the neckline or when the price retests the neckline. However, before we delve into that, take note of the following:
- The timelines: Similar to other chart formations, longer or medium-term analysis typically yields better results and gives a more accurate representation of the trend’s strength. Utilizing weekly or daily charts is highly recommended, as the likelihood of successfully identifying and predicting a trend on intraday charts is significantly lower;
- The time between the peaks: Ensure the duration between the two peaks is long enough, as the chances of the chart pattern succeeding are higher and less likely to fail. Peaks should be spaced at least a month apart to get an accurate representation of supply/demand. Too-closely-spaced peaks may indicate normal resistance rather than sustained changes in market dynamics;
- The magnitude of the decline: Ensure that the valley between the highs declines at least 10%. A decrease of less than this may not indicate a notable surge in sales pressure. After the decline, investigate the drop to gauge the strength of demand. If the trough persists for a stretch and decreases in volume as it moves back up, demand could be drying up, further confirming the reverse pattern;
- Trading volume: Ensure support is broken with an expansion of volume. The trend remains in force until it’s overturned with substantial evidence. Unless and until support levels are convincingly broken, we should assume that the trend is still intact and heading upwards.
There are two primary ways to trade the double top pattern:
- Place a sell order when the price breaks the neckline;
- Place a sell order when the price retests the neckline.
Place a sell order when the price breaks the neckline
The first method to trade a double top pattern is to go short when the price breaks through the neckline/support of the chart formation.
The chart below demonstrates when to enter the market, place a stop-loss order, and take profits.
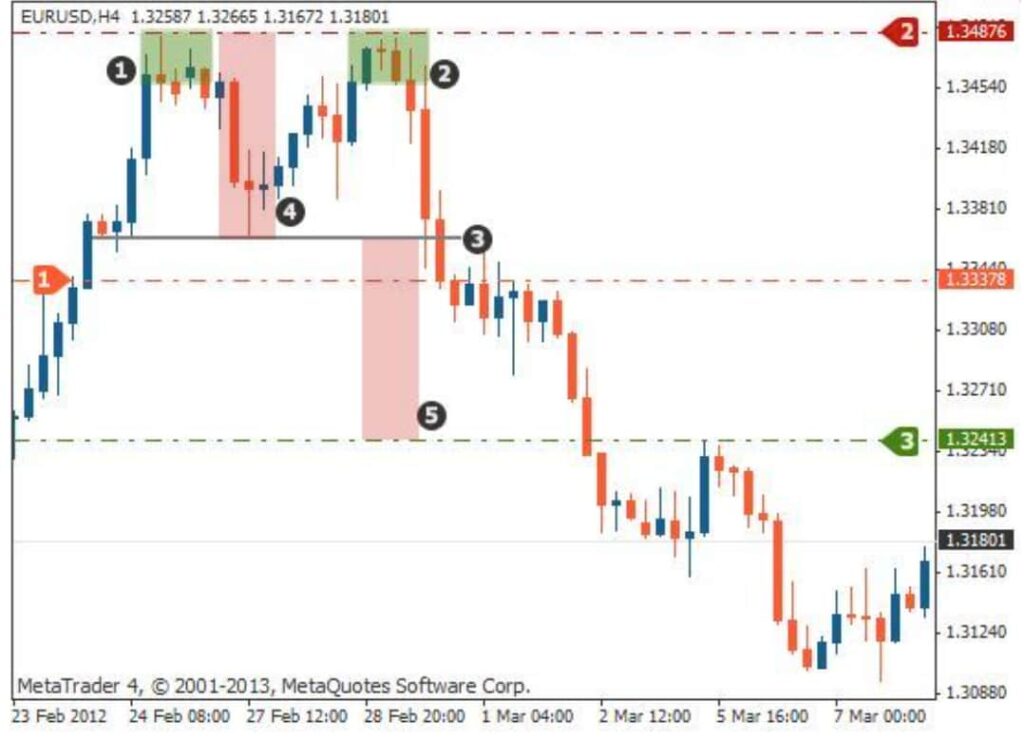
- Orange line: Traders should enter the market with a sell order when the price of an asset breaks the neckline;
- Red line: Strategically position the stop loss above the double top in order to protect your investments. If the price breaches this boundary, the pattern has been unsuccessful, and you must exit from your positions immediately;
- Green line: To estimate the profit target, take the length of the actual pattern and extend the distance down from the neckline.
Place a sell order when the price retests the neckline
The second method to trade the double top pattern is to wait for the asset to trade below the neckline/support and go short once the price retests the neckline as resistance (broken support is now resistance).
The chart below demonstrates when to place a sell order, a stop-loss, as well as when to take profits.
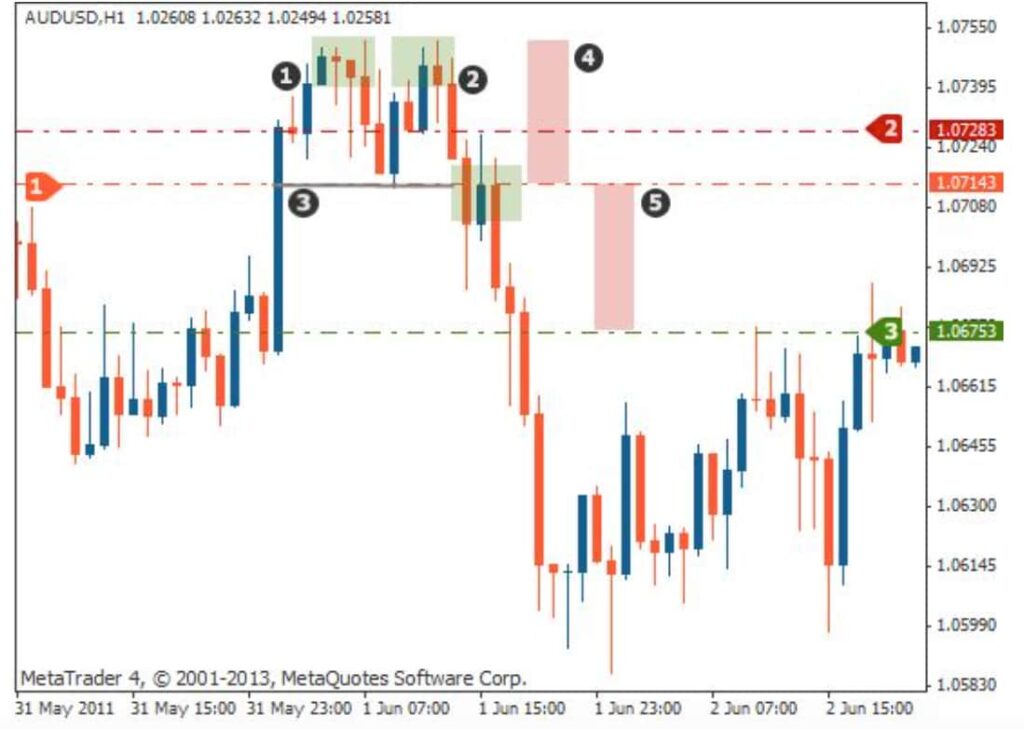
- Orange line: Short entry at the retest of the neckline as resistance;
- Red line: The stop loss would go above the new resistance area after the price has retested the neckline;
- Green line: Like the first example, to estimate the profit target, take the length of the actual pattern and extend the distance down from the neckline.
Failed double top pattern
There is a significant difference between a genuine double top and one that has failed. A failed double top chart pattern is formed when the anticipated market direction doesn’t develop as expected. A real double top, on the other hand, will indicate undeniably bearish conditions, signaling the potential steep drop in the price of a particular asset.
To correctly identify a double top pattern, it is crucial to be patient and determine the critical support level. By solely relying on the formation of two successive peaks to define a double top, you might end up with an inaccurate reading and premature exit from your position.
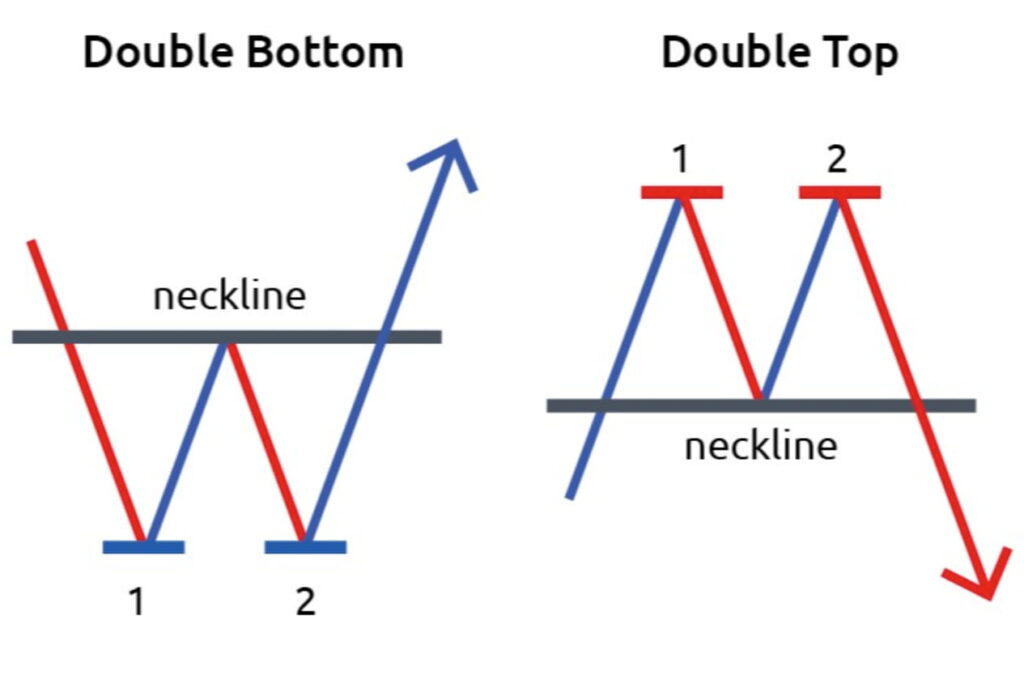
Double top vs. double bottom pattern
Double tops and bottoms are chart patterns that signify a reversal from the prevailing trend. A double top has an “M” shape and indicates a bearish reversal in trend, while a double bottom has a “W” shape and is a signal for a bullish price movement.
A double bottom pattern describes the further drop in the price of a security after a long consistent downtrend, a rebound, another decline to the same or similar level as the initial drop, and finally, another rebound that will likely become a new uptrend.
Unlike trading a double top, where traders take a short position, after a double bottom, traders would typically take long positions that will profit from the rising price.
Pros and cons of the double top pattern
Like most other technical analysis tools, chart patterns such as the double top also come with their own distinct advantages and disadvantages. To fully harness this technical indicator in your trading strategy, it’s essential to understand where it triumphs and where it can fall short.

Pros
- Solid indication of a trend reversal: When identified correctly, double tops are highly effective at signaling the start of a bear market;
- Can demonstrate entry/stop loss/take profit levels: When identified correctly, double tops can suggest lucrative shorting opportunities;
- Can be applied to various financial instruments: Traders can plot double top patterns on different asset classes, including currencies, commodities, and stocks:
- Versatile: Useful as a standalone tool or in conjunction with other technical indicators.

Cons
- Incorrect interpretations: A double top formation is a powerful tool when correctly identified; however, it can be incredibly damaging if misinterpreted. Despite the shape being rather apparent in the example charts above, they may appear differently and come with slight variations on actual price charts, leading to inaccurate identification of the formation;
- False breakouts: Double top formations are prone to failures and false breakouts, as with any other chart patterns;
- Jumping the gun: Many traders can enter the market too early, before the pattern is complete, leading to significant losses;
- Limited: As with all technical indicators, double top patterns should only be utilized as a part of a complete trading plan and should not be employed in isolation.
In conclusion
As with any other chart patterns used in technical analysis, a double top pattern is not guaranteed to succeed and is always up for individual interpretation.
To confirm a pattern and detect false signals, ensure all criteria are present, including a solid bullish upward trend before the first peak and increased trading volume when breaking the support level.
Additionally, as with all indicators, it is crucial to confirm chart patterns with other aspects of technical analysis. Remember, the more confirming factors are present, the more robust and reliable a trade signal is likely to be.
Disclaimer: The content on this site should not be considered investment advice. Investing is speculative. When investing, your capital is at risk.
FAQs about double top pattern
What is a double top pattern?
A double top pattern is a chart formation used in technical analysis for trading various financial instruments such as stocks and cryptocurrencies and indicates a potential reversal in an upward trend.
Is double top pattern bullish or bearish?
A double top pattern is a bearish price reversal that signals the end of a bullish market, demonstrating that the sellers in the market are beginning to prevail, i.e., the supply is overtaking the demand.
What does a double top pattern chart look like?
To identify a double top pattern, look for a letter “M” shaped formation on a chart with two roughly equal peaks that occur after one another. The peaks include a moderate trough in-between. The pattern is confirmed once the price falls below a support level equivalent to the low between the two previous peaks.
What's a typical double top pattern strategy?
The double top pattern can indicate potential shorting opportunities. There are two main ways to trade a double top pattern: either place an order to sell once the price breaks through the neckline or when the price retests the neckline.
How effective is the double top pattern in forex trading?
The double top pattern is prevalent in forex trading and can be a reliable indicator of a bearish reversal if identified correctly. However, like all trading patterns, it’s essential to use it in conjunction with other indicators and tools, ensuring more accurate predictions in the volatile forex market.
What is the double top pattern in crypto trading?
The double top pattern in crypto refers to a chart formation that indicates a potential reversal of an upward trend. It is characterized by two peaks at roughly the same price level, separated by a trough. The pattern suggests that the cryptocurrency has reached a resistance level twice and has failed to break through. If the price then falls below the support level (usually the lowest point between the two peaks), it can be a sign that the crypto asset is entering a bearish phase.
What is the breakout double top pattern?
The breakout double top pattern is a technical analysis chart formation indicating a potential bearish reversal. It occurs when the price of an asset forms two distinct peaks at approximately the same level, with a moderate trough in between. This pattern suggests that after reaching a high point twice and failing to break through, the asset may experience a trend reversal from bullish to bearish.
What's the typical double top pattern entry?
When trading a double top pattern, the typical entry point is after the pattern is confirmed, which happens when the price falls below the support level formed between the two peaks. Traders often wait for the price to break this support level and may enter a short position, anticipating a bearish trend.
Best Crypto Exchange for Intermediate Traders and Investors
-
Invest in cryptocurrencies and 3,000+ other assets including stocks and precious metals.
-
0% commission on stocks - buy in bulk or just a fraction from as little as $10. Other fees apply. For more information, visit etoro.com/trading/fees.
-
Copy top-performing traders in real time, automatically.
-
eToro USA is registered with FINRA for securities trading.