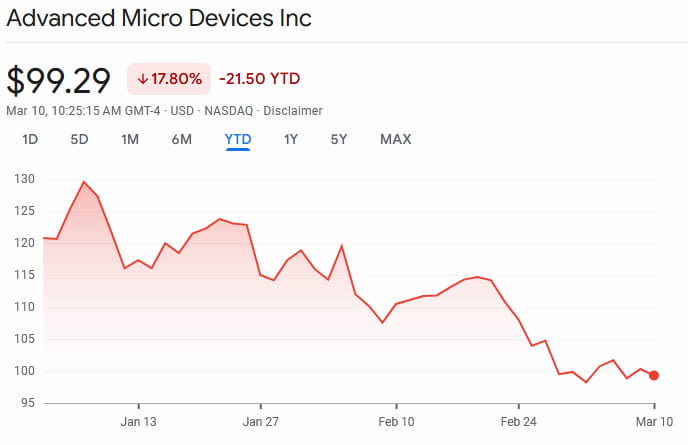
Advanced Micro Devices can’t seem to catch a break. AMD stock (NASDAQ: AMD) has been trending downward for an entire year.
AMD shares have been trading around $100 — give or take a few dollars, since late February. At press time on March 10, Advanced Micro Devices stock was changing hands at a price of $99.29, with year-to-date (YTD) losses standing at 17.80%.
The chipmaker’s latest line of products performed admirably against Nvidia’s, at least per benchmarks. The Lisa Su-led venture’s last earnings call, held on February 4, saw both earnings per share (EPS) and revenues come in above consensus estimates.
In spite of this, one crucial metric, data center revenue, was not up to Wall Street’s standards. Analysts subsequently cut their price targets for Advanced Micro Devices shares.
However, the stock is increasingly looking like a value play. One technical analyst seems to think so — as the stock has reached oversold levels, a correction to the upside might be due soon.
Can AMD stock surge to $320?
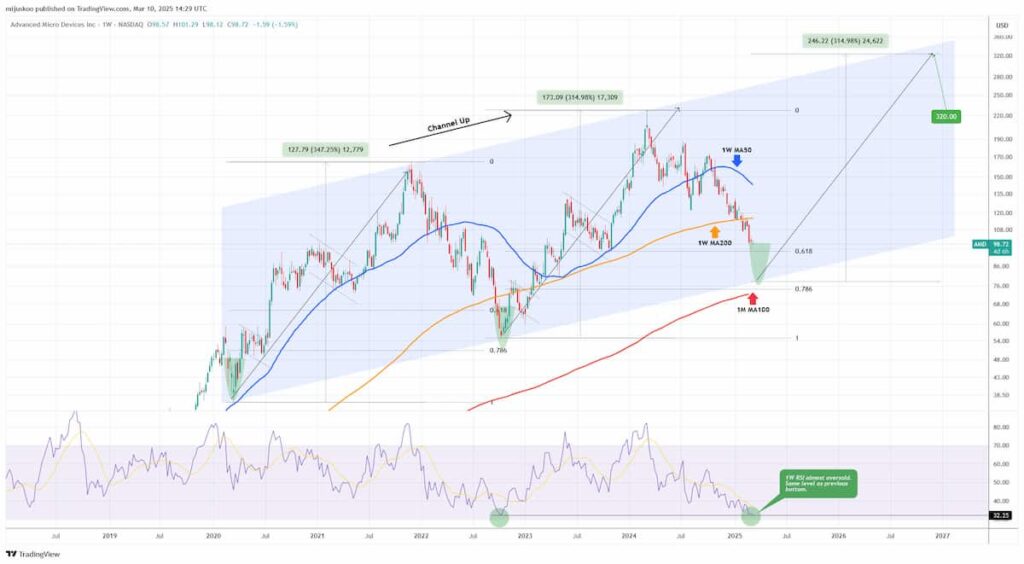
Per noted chart researcher TradingShot, AMD stock has been in a channel up pattern for the last five years, as detailed in a March 7 TradingView post. The $202 all-time high (ATH) reached almost exactly a year ago, on March 1, 2024, represents a higher high within that pattern.
At present, price action is in a bearish leg of this channel up pattern. In addition, prices are close to the 0.618 Fibonacci extension. During the previous bearish leg, when the 0.618 Fib level was breached, prices bottomed within a matter of weeks at the 0.786 Fib level, before a bullish leg was initiated.

To boot, the relative strength index (RSI) for AMD stock currently reads 32.25 — and levels below 30 indicate oversold conditions.
So, what does all of this mean, in practical terms? Here is how things would play out if AMD stock mirrors prior performance.
First, prices will reach a low near $78, at the 0.786 Fib level, which also represents the lower trendline of the channel up pattern.
From there, prices will rebound and enter a bullish leg of the channel up. Last time around, this continued move to the upside results in a total gain of 314.98% over the course of roughly a year and a half. In this case, that rally would bring the price of AMD shares up to $320
The analyst had also previously outlined a case as to how AMD stock could surge to $148 in the near-term — although readers should note that the lower trendline of the descending channel pattern used in this analysis has since been breached, so the validity of the pattern is questionable.
Featured image via Shutterstock