
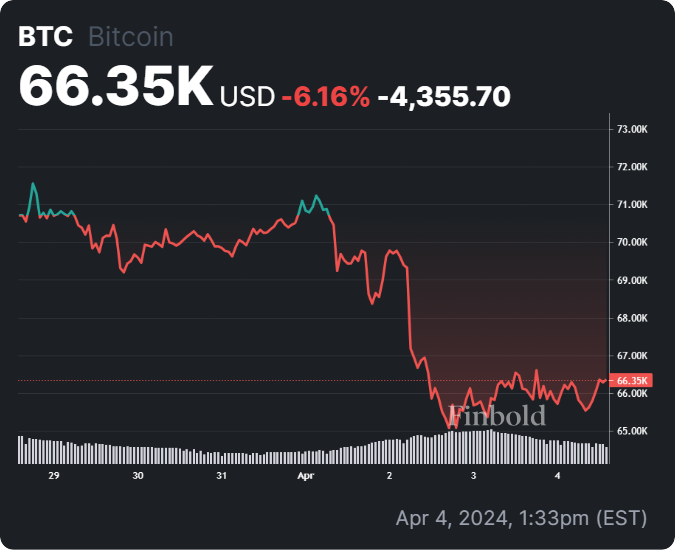
Bitcoin (BTC) is currently trading below the $70,000 mark, with market sentiment teetering on the edge as the maiden cryptocurrency showcases short-term volatility.
In recent weeks, the $70,000 level has emerged as a critical support in Bitcoin’s quest to reach the coveted $100,000 milestone.
In this line, a crypto trading expert recently suggested that Bitcoin could be lining up for a significant drop in valuation after the halving event to below $60,000, according to pseudonymous analyst TradingShot, in a TradingView post on April 4.
Based on the one-week timeframe, the analysis suggests that Bitcoin’s trajectory may see a correction towards the 0.382 Fibonacci retracement level. The expert cited historical trends, noting that previous corrections have seen Bitcoin retreat towards the 0.382 Fibonacci retracement level measured from previous lows.
Per the leading analyst, Bitcoin has registered a channel-up trend since the November 2022 bottom during the FTX collapse period. The market strategist pointed out that each bullish leg that goes to a higher height shows a slightly weaker performance.
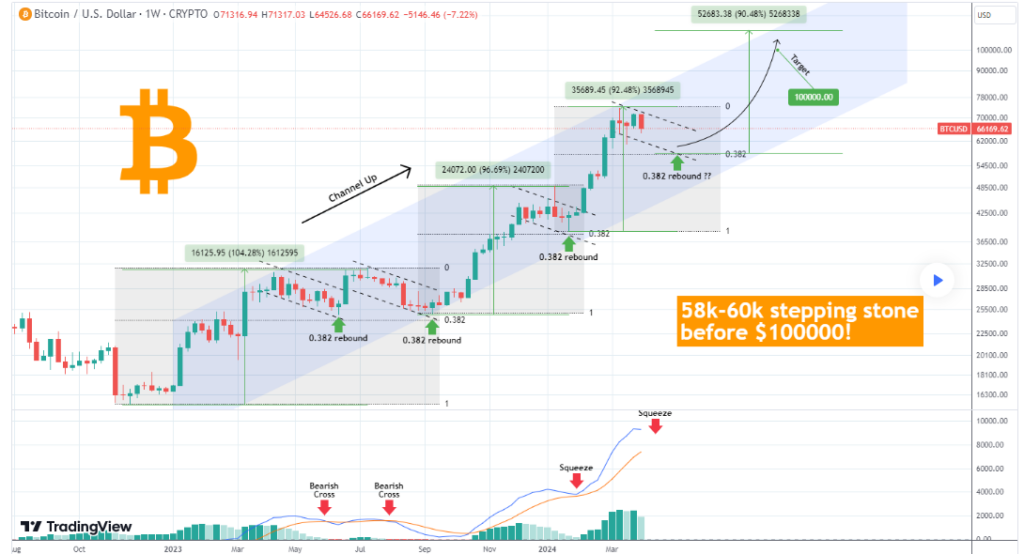
By observing a decreasing rate in percentage gains for each higher high, the expert predicted that the next higher high may experience a 2% decrease.
Levels to watch
Applying this model, TradingShot suggested the possibility of a pullback to below $60,000 after halving before a new rally potentially drives Bitcoin to $100,000.
“That gives us a $110000 Higher High target but it is always safer to start taking profits (medium-term at least) around $100k. So if this model continues to repeat those systemic sequences, we are looking at the possibility of a 60-58k pullback towards and marginally after the halving and then new rally to $100k,” the expert said.
It’s worth noting that despite Bitcoin’s dip at the start of April, the flagship cryptocurrency enjoyed a robust first quarter. However, the recent drop below $70,000 coincided with notable performances in other sectors of the economy.
For example, Bitcoin’s correction occurred alongside a rise in U.S. Treasury yields, which reached their highest level of the year, while the dollar continued to demonstrate strength.
Although U.S. economic data has been strong, concerns persist regarding inflation, a factor likely to influence decisions on Federal Reserve interest rates.
Bitcoin price analysis
Bitcoin price today was trading at $66,314 by press time, marking a modest rally of less than 0.5% over the past 24 hours. However, on the weekly chart, BTC has seen a decline of 6%.
Meanwhile, Bitcoin investors are closely monitoring its short-term price trajectory. Sustaining trading above the $65,000 support level could propel Bitcoin towards the $70,000 mark.
Disclaimer: The content on this site should not be considered investment advice. Investing is speculative. When investing, your capital is at risk.