
For almost an entire month, it appeared as if Jim Cramer, the famous host of CNBC’s Mad Money, was spot on when he recommended investors go long on SoFi Technologies (NASDAQ: SOFI) and said he remains a buyer.
Since then, however, the stock of the financial technology company went into a sharp decline and is, in fact, down as much as 18.86% since January 1. Additionally, while it briefly surged on January 29, it subsequently declined – putting it at $7.83.
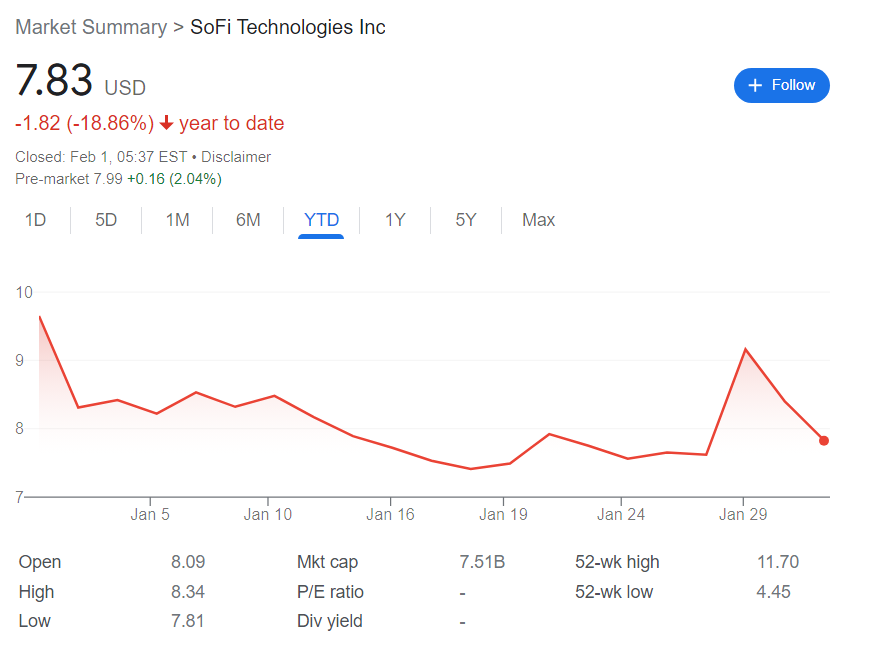
Still, despite the mixed performance, SoFi remains an interesting player in the stock market given that its recent surge – no matter how brief – was triggered by the company reaching a significant milestone: its first-ever quarterly profit.
Analysts assess SoFi’s prospects
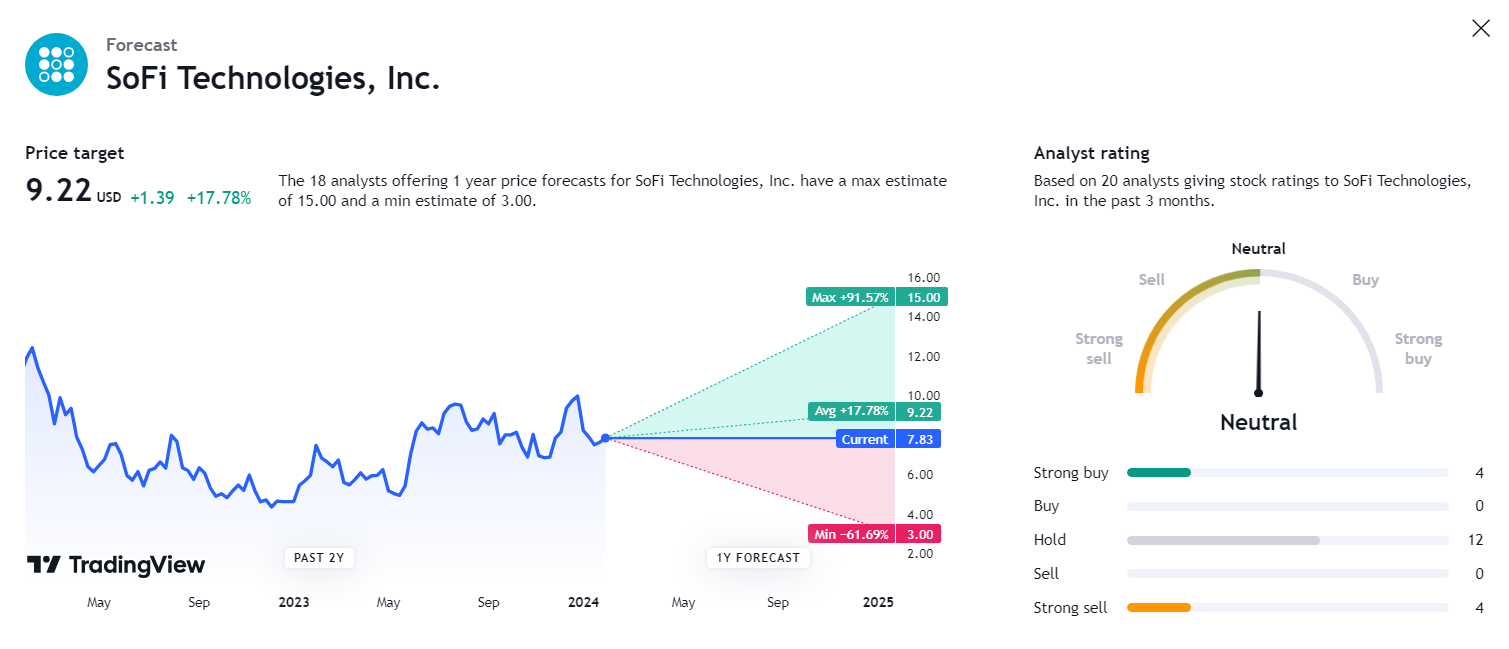
Given SoFi’s performance, it is probably not surprising that experts – at least when it comes to the 20 analyzed by TradingView – are sharply divided on the stock. While the company’s overall rating is logged as “neutral,” it has an equal number of experts that urge selling and buying – four and four.
Still, the vast majority – 12 of 20 – simply rank SoFi Technologies as a hold.
Again, logically following the company’s performance on the stock market, the 12-month price targets demonstrate everything but an expert consensus. The high target, for example, would see SoFi surge 91.57% to $15.
On the other side, the low estimate would see the firm’s shares drop almost as much – 61.69% – down to $3. Ultimately, on average, SoFi’s 12-month price target stands at $9.22, constituting a 17.78% upside.
While the stronger-than-expected earnings report that offered SoFi’s first-ever quarterly profit certainly drove the bullish sentiment on the stock, the fact that its loan portfolio – particularly its unsecured loans – also raised concerns and was, at least partially, a cause for the stock’s decline since January 29, and for some of the more bearish 12-month forecasts.
SoFi stock technical analysis
Finally, while experts are divided on the financial technology company, technical analysis (TA) indicators for the stock are significantly more alarming.
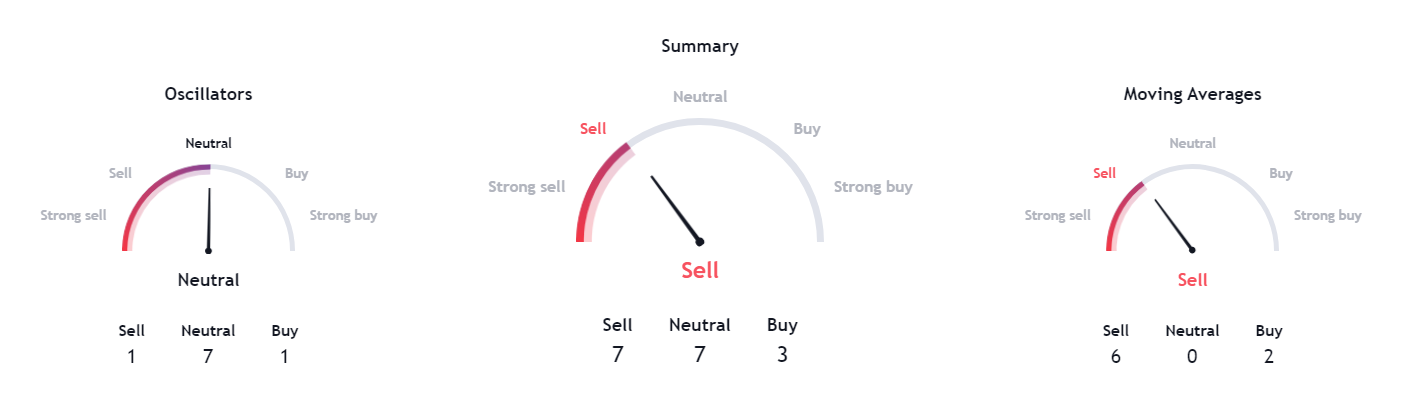
While the oscillators give a neutral reading to SoFi based on its 30-day movements, moving averages signal a decisive sell. Technicals based on shorter time frames – one week or 24 hours – are either equally or even more alarming and rank the stock as either a “sell” or even a “strong sell.”
Buy stocks now with Interactive Brokers – the most advanced investment platform
Disclaimer: The content on this site should not be considered investment advice. Investing is speculative. When investing, your capital is at risk.