Last month, the US dollar (USD) reached an unprecedented high of 83.44 against the Indian Rupee (INR). This surge was ignited by a combination of factors, including a slump in oil prices and hawkish statements from the Federal Reserve, bolstering the greenback’s position.
Since reaching the peak, the USD/INR pair has embarked on a tumultuous journey, marked by several significant fluctuations.
However, recent developments allowed the US dollar to once more gain strength against the Rupee, driven by mounting pressures on INR’s trade balance.
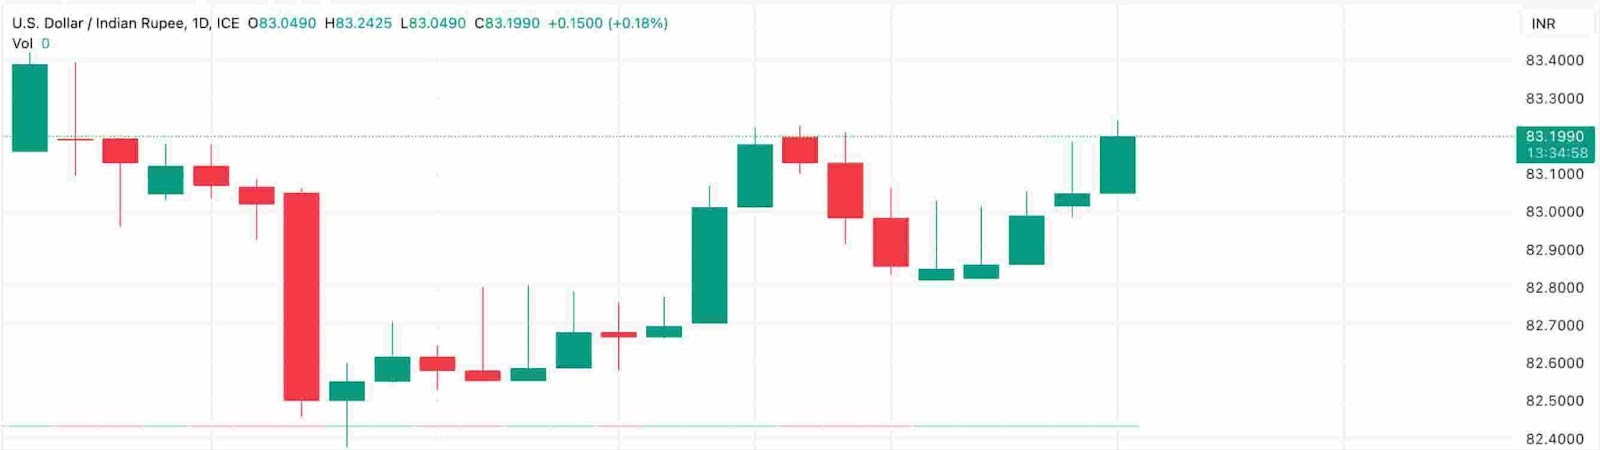
As a result, the USD gained more than 0.25% against the Rupee over the past week, with the currency pair currently trading at 83.19, according to the data retrieved on September 18.
Why is INR declining?
The latest weakness in the Indian Rupee comes after reports showed that the trade deficit in the South Asian country widened to a 10-month high of $24.2 billion in August, marking a substantial increase from the $20.7 billion reported in the month prior.
Furthermore, a dip in the annual inflation rate in August put additional pressure on the currency. Notably, data showed that inflation in India fell to 6.8% last month from 7.4% in July.
Additionally, Shaktikanta Das, the Governor of India’s central bank, said he expects inflation to continue easing from September onward. This could lead to a more dovish monetary policy approach by the bank’s policymakers and further weigh on the INR.
Meanwhile, on September 15, India’s Finance Minister Nirmala Sitharaman said that the country is currently in talks with 22 other nations to facilitate bilateral trade transactions in the Indian Rupee. The move is aimed at strengthening trade ties and potentially reducing its dependence on foreign currencies in international trade.
USD/INR technical analysis
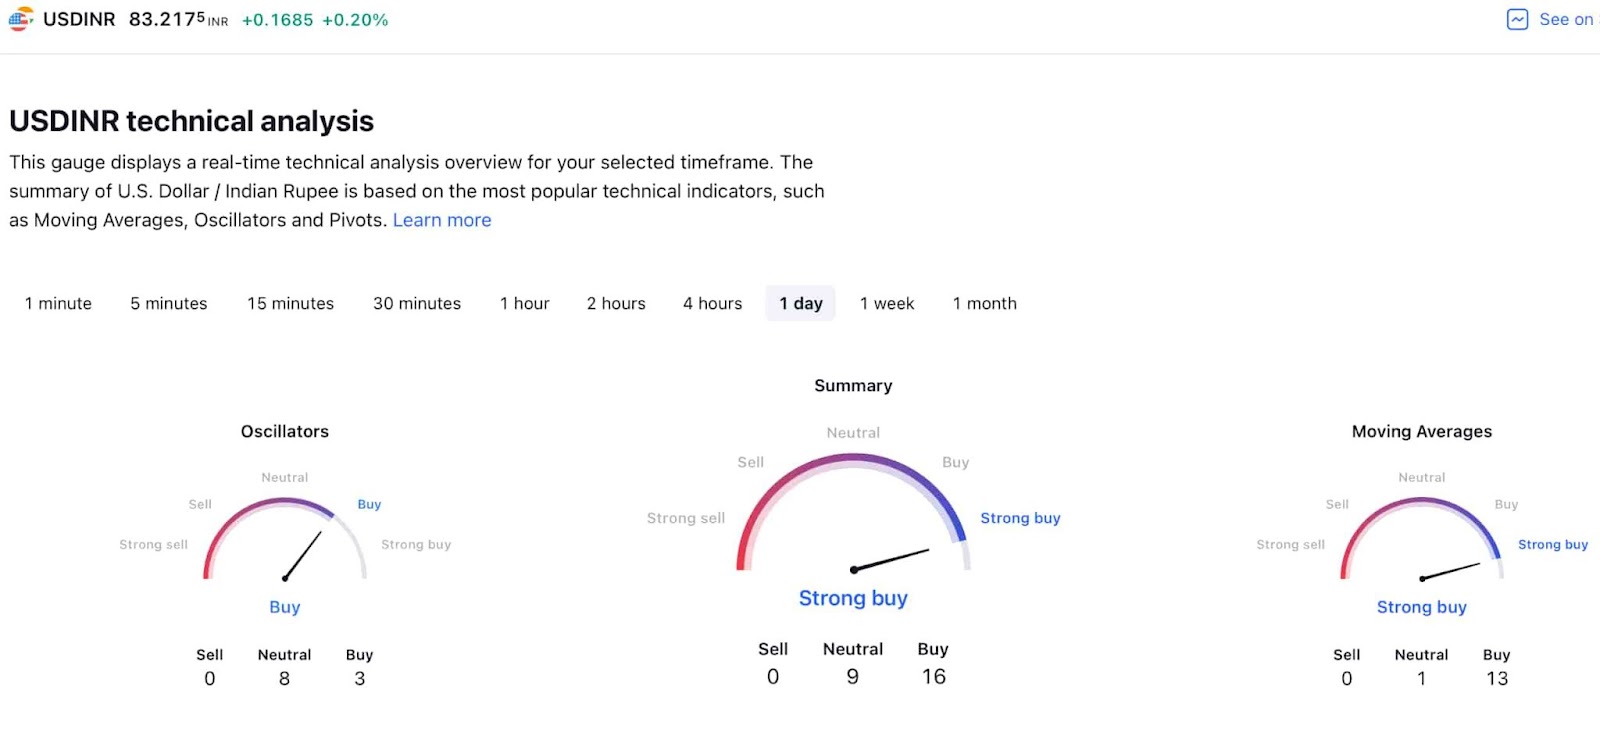
The US dollar’s favorable position against its Indian counterpart is reflected in the pair’s technical analysis.
Notably, the 1-day gauge on TradingView is suggesting a ‘strong buy’ for USD/INR, with 16 indicators offering a ‘buy’ rating and 9 being ‘neutral.’ No technical indicators are recommending a ‘sell’ at the moment.
The bullish sentiment is mainly seen in oscillators and moving averages (MAs), with the latter showing a ‘buy’ at 13.
Although the USD has once again gained momentum against the Rupee, the greenback has also come under pressure recently, probably due to a downbeat US consumer sentiment data published on Friday.
To be more specific, the preliminary US Michigan Consumer Sentiment Index was reported at 67.7, representing a noteworthy decrease from the previous reading of 69.5, and also below the expected 69.1.
82% of retail CFD accounts lose money.
Disclaimer: The content on this site should not be considered investment advice. Investing is speculative. When investing, your capital is at risk.