Summary
⚈ In 2020, when the ratio reached an all-time high of 124, silver prices doubled while gold increased by 31%; similarly, in 2010, silver surged 223% compared to gold’s 45% gain.
⚈ Given the current disparity and historical patterns, silver may outperform gold by the end of 2025, especially if silver prices rise to approximately $44.48 per ounce to match gold’s projected gains.
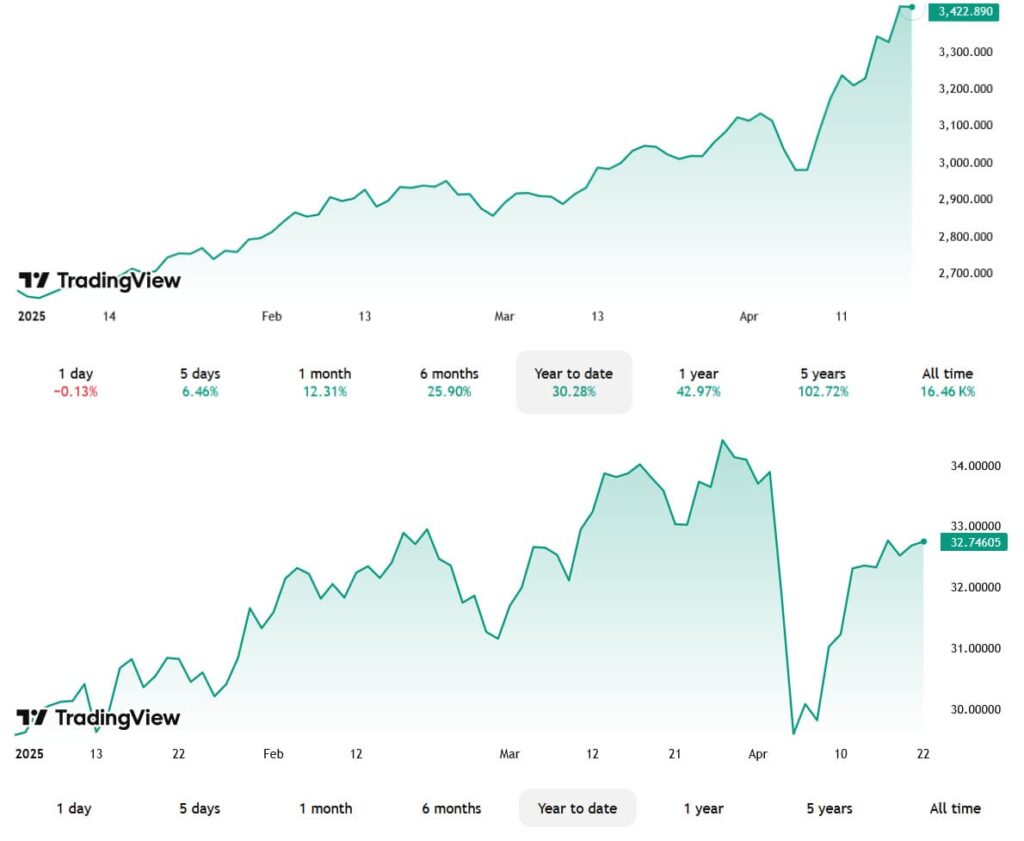
On April 9, the price of gold shot past $3,000 per ounce on the back of geopolitical tensions and reached an all-time high of $3,431 by press time on April 22, marking a 30.28% gain since the start of the year.
Silver, in contrast, has seen prices increase from $29.56 per ounce to $32.74 in the same timeframe — which equates to a 10.75% rally.
Despite underperforming against the yellow metal, an interesting and incredibly rare technical indicator suggests that silver could generate superior returns to gold by the end of the year.
Gold to silver ratio shoots past 100 for the first time since 2020
As of April 22, the gold to silver ratio sits at 104.74. In simple terms, this means that roughly 104.74 silver ounces are required to purchase one ounce of gold.
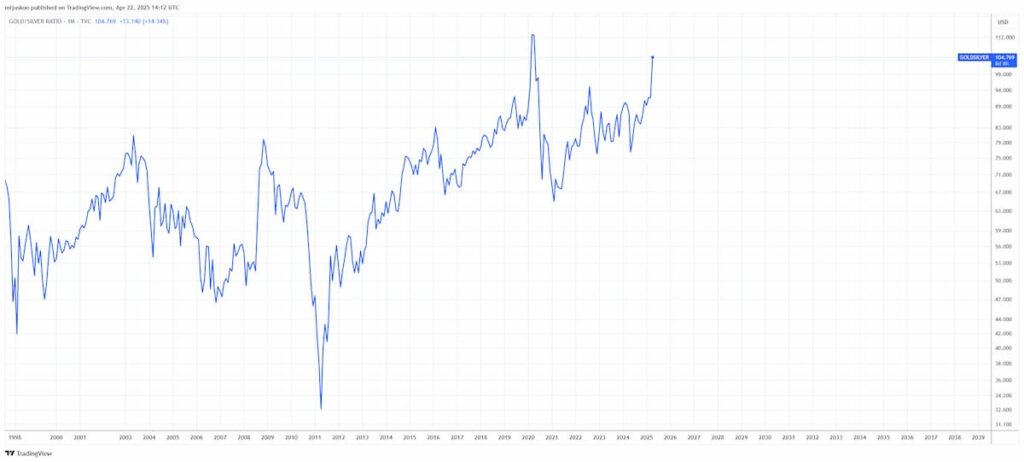
Here’s why that matters — similarly high disparities have occurred only twice in the last 25 years. In both instances, silver outperformed gold by a significant margin in an ensuing rally.
The most recent occurrence was 2020, when the ratio reached an all-time high (ATH) of 124. What followed was a 100% increase in silver prices, while gold rallied by 31%. Before that, the ratio reached a local high of 70 in 2010 — silver gained 223% in the 14-month surge that followed, while gold prices increased by 45%.
With the move past $3,000, the next expectation is that gold will reach a price of $4,000 per ounce in 2025. That would bring its yearly return to roughly 50.48%. Silver prices would have to reach approximately $44.48 per ounce to match those gains.
If price action mimics what was seen in earlier instances of such a large disparity between the two commodities (particularly in view of the forecasted reduction in silver production), the gray-hued metal could outperform gold by the end of the year.
Featured image via Shutterstock