As most assets in the cryptocurrency market are back in the sideways trading mode, XRP has been no exception, but a certain technical analysis (TA) chart pattern has emerged that suggests the period of stagnation for this cryptocurrency could be over in the near future.
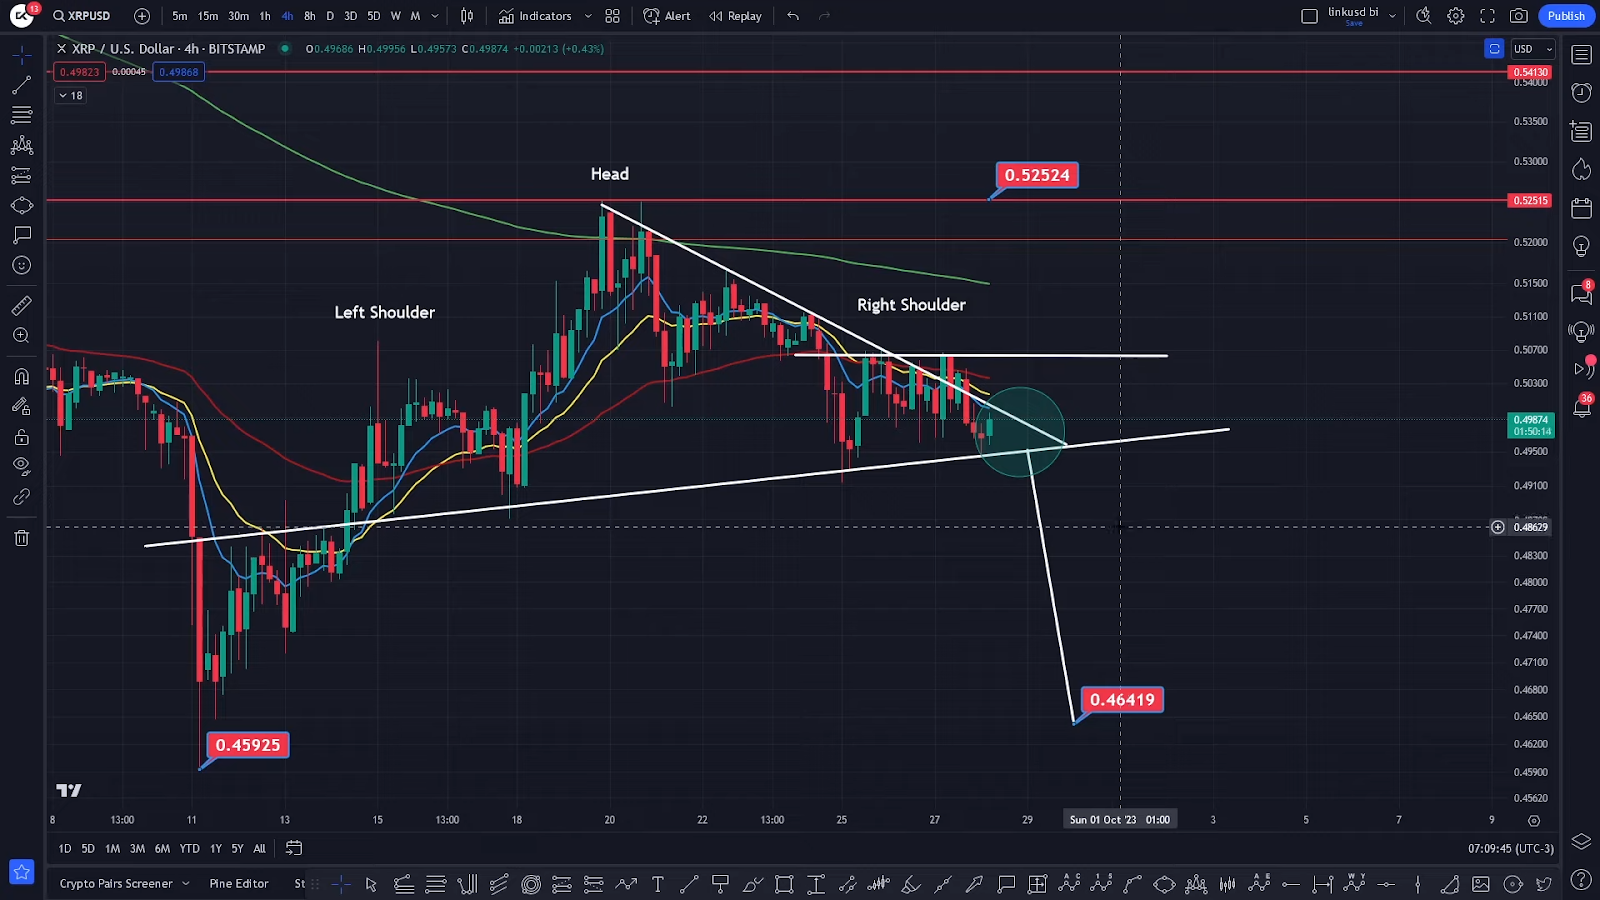
Specifically, the pseudonymous crypto expert CoinsKid has shared a teammate’s analysis, in which he observed that XRP had formed a head and shoulders pattern, which typically indicates a bearish reversal, as explained in a video streamed on September 28.
Bearish scenario
In this case, the analyst has suggested that if the XRP token breaks down from this head and shoulders pattern, which consists of three peaks – a higher peak (head) between two lower peaks (shoulders) – it could lead to a significant price decline, roughly towards $0.46419, as the crypto expert pointed out.
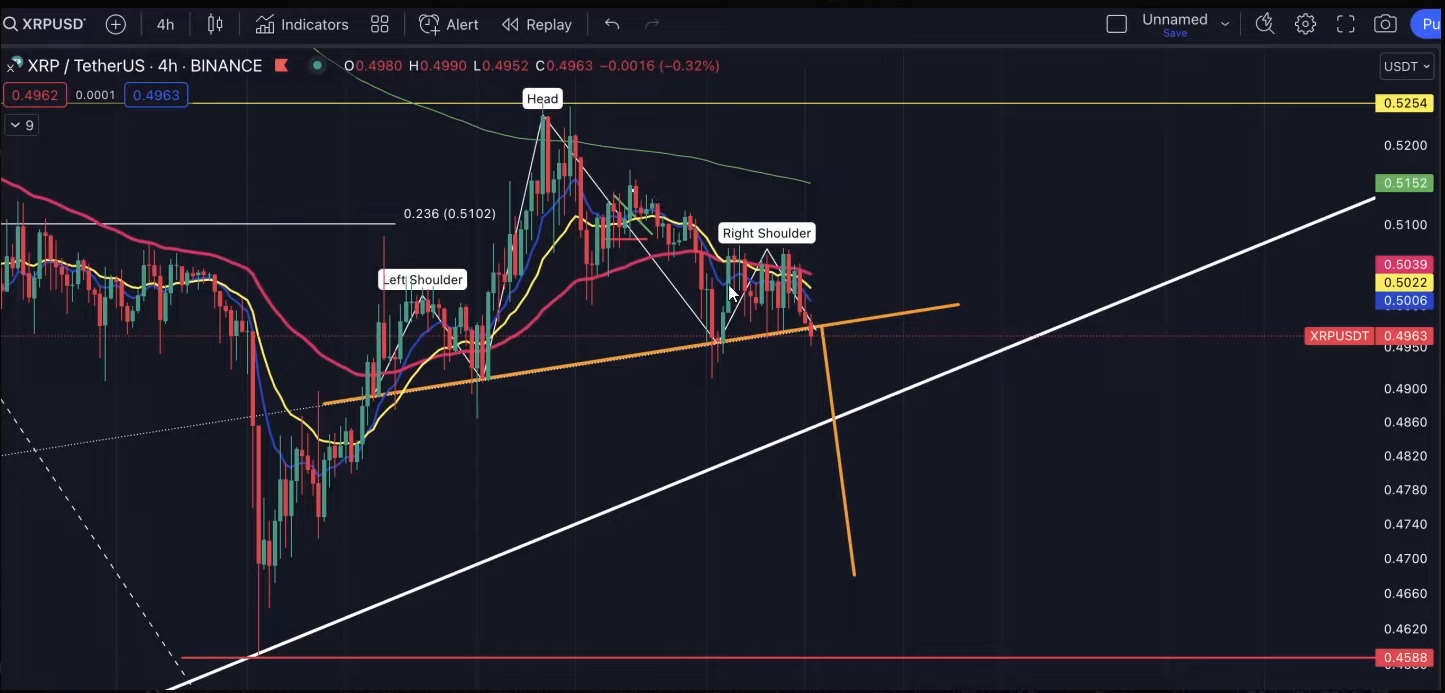
Indeed, this chart pattern concludes when the price breaks below the neckline, which represents the support level that connects the lows of the left and right shoulders. CoinsKid identified these key support and resistance levels on the XRP chart, the former at around $0.49515 and the latter at $0.49864.
Finally, as he concluded:
“Keep an eye on this chart over the next few days here because I do think we’re getting really, really close. Tomorrow is the breakout point for this particular chart because you can clearly see we’re getting a very, very powerful level of resistance just there for XRP.”
Bullish scenario
On the other hand, CoinsKid has also identified an ascending triangle pattern, which is the opposite of a bearish pattern and represents a bullish continuation chart pattern created by placing a horizontal line along the swing highs (resistance points) and an ascending trendline along the swing lows (support points).
“We’ve got this beautiful ascending triangle where XRP will start to come back up, attack that 200 EMA ($0.51518) on the 4-hour time frame, and then begin to attack the head ($0.52515), and then all the shorts piling on down here (between $0.492 and $0.506), it’ll just get stopped out and liquidated, and it just adds more fuel to this.”
XRP price analysis
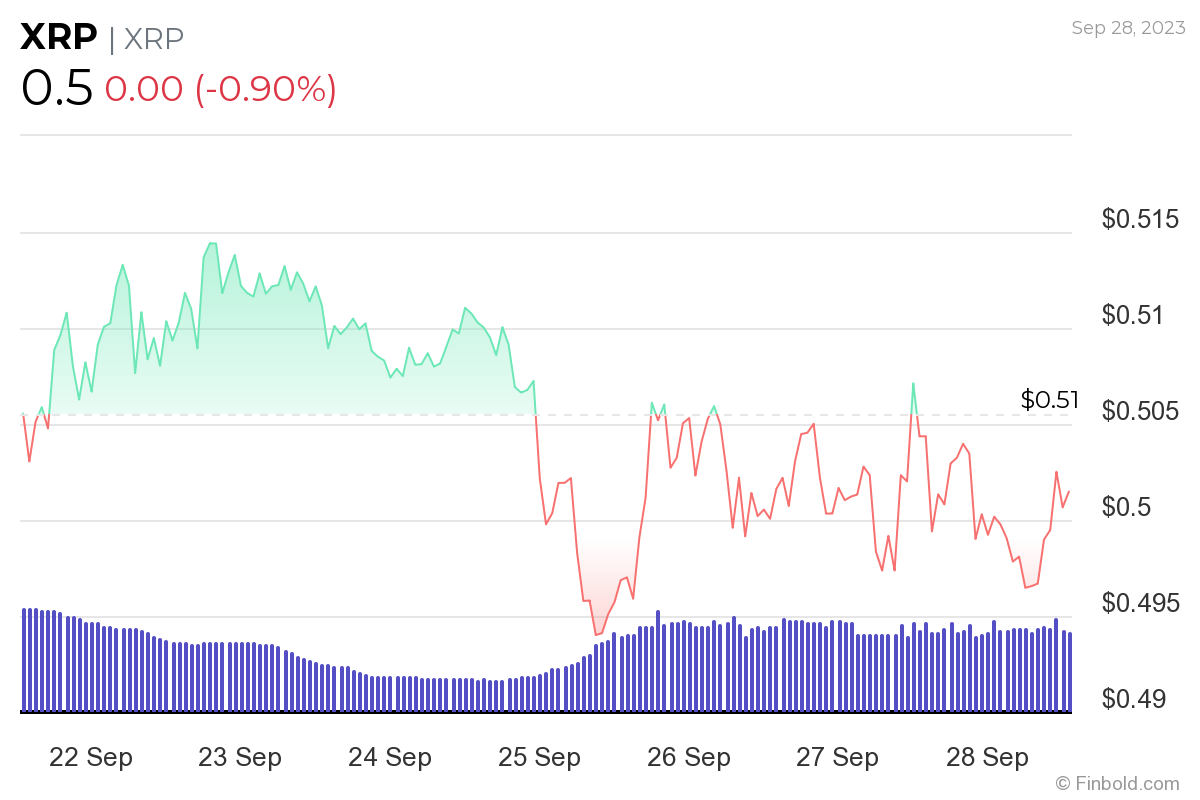
Meanwhile, at press time, XRP was changing hands at the price of $0.49979, which represents a decline of 0.9% in the last 24 hours, a 0.97% loss across the previous seven days, as well as a dip of 3.04% over the past month, as the most recent charts demonstrate.
All things considered, whether the expert was correct in his predictions or not will depend on many factors, among them the developments related to the legal standoff between the United States Securities and Exchange Commission (SEC) and blockchain company Ripple.
Watch the entire video below:
Disclaimer: The content on this site should not be considered investment advice. Investing is speculative. When investing, your capital is at risk.