The head and shoulders pattern is regarded as one of the most trustworthy chart patterns in technical analysis. As a result, both beginner and experienced traders use it to their advantage to find new trading opportunities. This guide will define what is the head-and-shoulders pattern, describe how to interpret it, provide examples, and demonstrate how to apply it to make profitable trades.
Best Crypto Exchange for Intermediate Traders and Investors
-
Invest in cryptocurrencies and 3,000+ other assets including stocks and precious metals.
-
0% commission on stocks - buy in bulk or just a fraction from as little as $10. Other fees apply. For more information, visit etoro.com/trading/fees.
-
Copy top-performing traders in real time, automatically.
-
eToro USA is registered with FINRA for securities trading.
What is a head and shoulders pattern?
In simple terms, the head and shoulders top pattern suggests stock prices that have been increasing over time – a bullish phase or upward price trend- is about to reverse, and prices may start going down again – entering a bearish phase or downward trend.
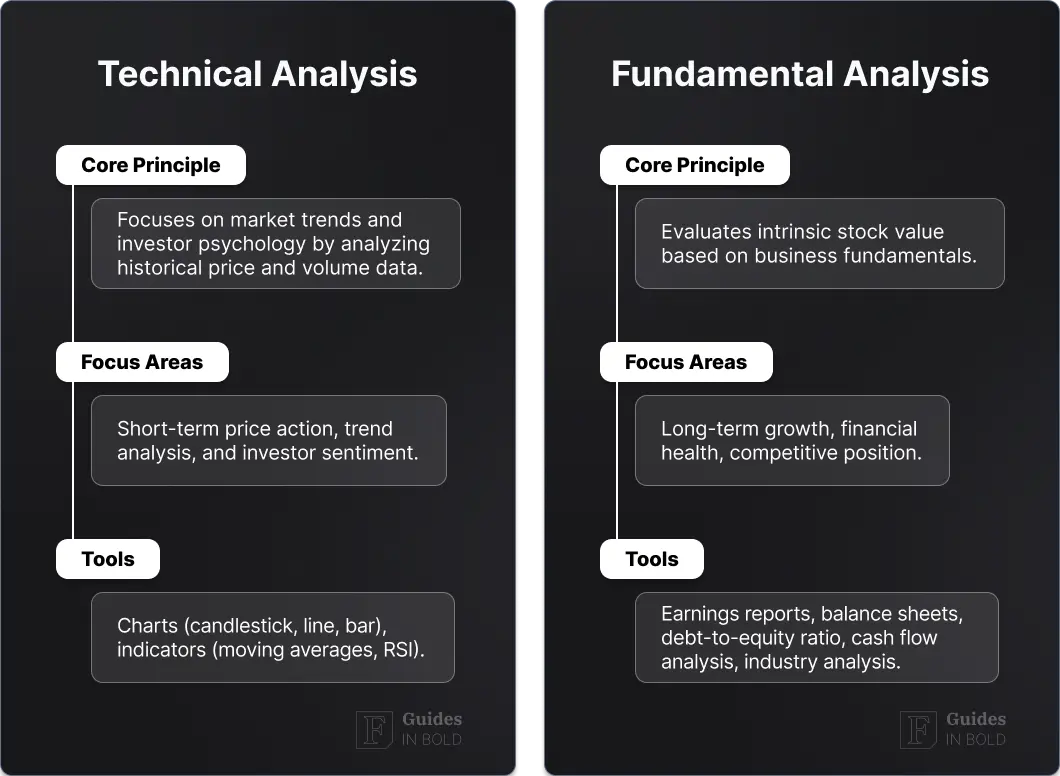
- Technical analysis is a method used by investors to find profitable trading opportunities by analyzing historical price and volume data presented on charts to see if any patterns could indicate if prices are about to go up or down and show a good time to buy or sell.
- Chart formations or price patterns form if past price data or another metric such as volume or the number of trades presented on charts. Technical analysts try to look for and identify these patterns and formations to forecast what prices might do next by looking at past movements.
There are a variety of well-known chart formations, in addition to those a trader could identify on their own. A chart formation is defined as any pattern that has the potential to predict future price movements.
Although every pattern is nothing more than an indicator and the subjective interpretation of an individual’s perspective for conjecture. Ultimately the head and shoulders pattern is considered one of the most reliable chart formations due to its long-standing history among analysts.
Its opposite is an inverse head and shoulders pattern that is the same but reverse and hints at an upward price trend – a bearish-to-bullish trend reversal.
Formation of the head and shoulders chart pattern
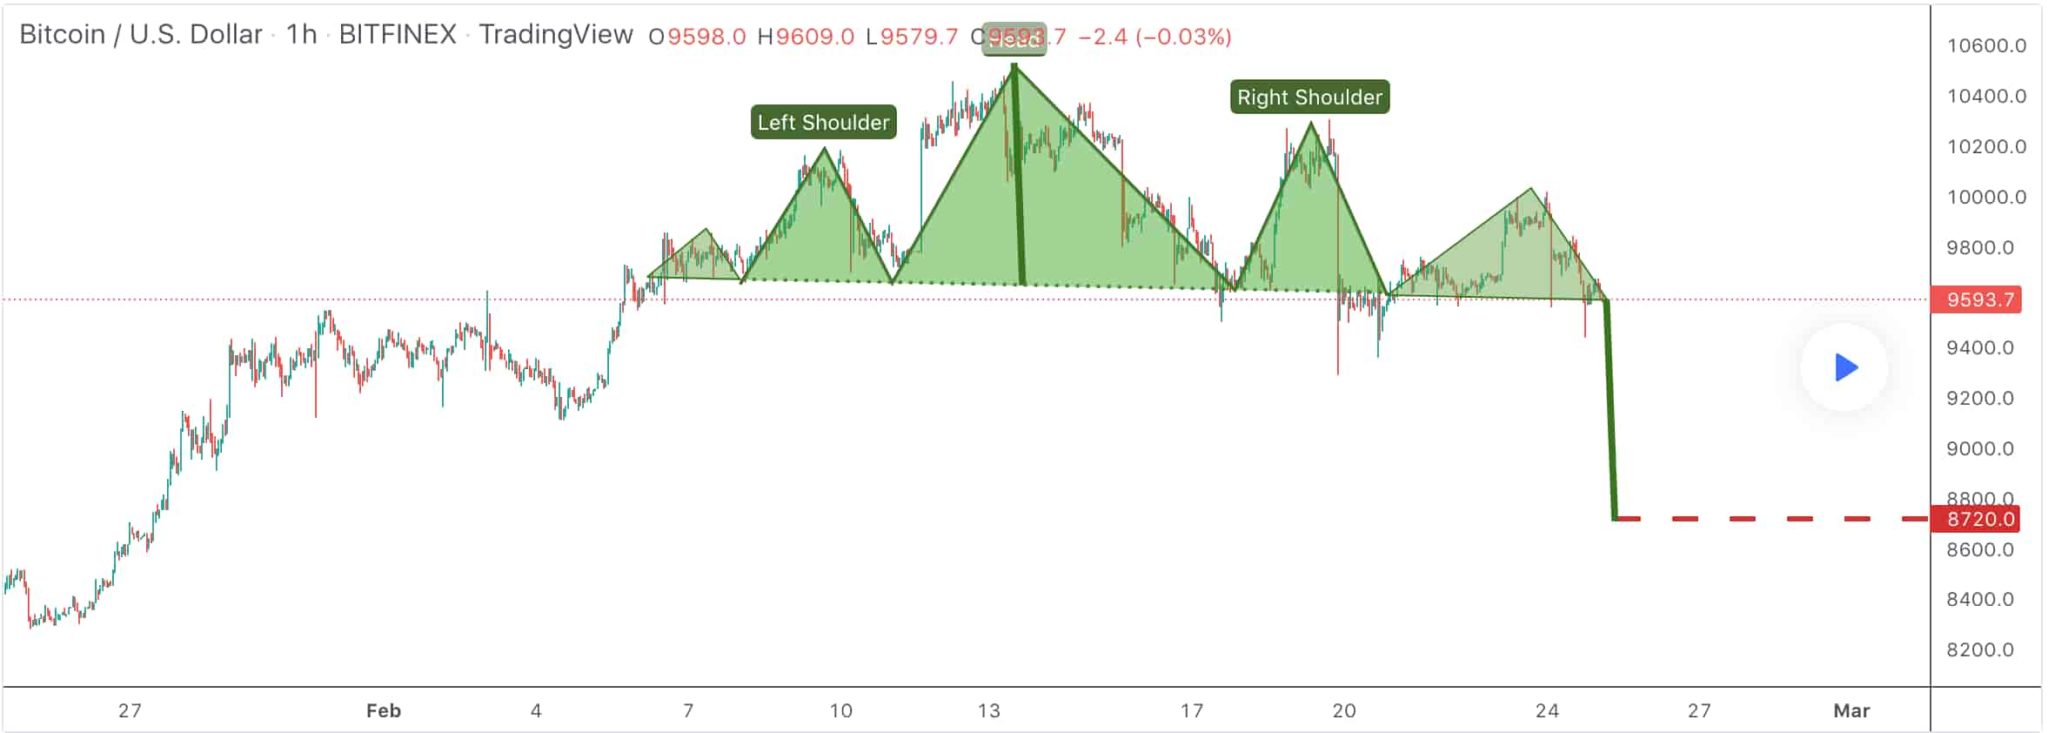
The head and shoulders pattern appears on a chart as three peaks, with the middle peak being slightly higher than the two sides, forming a “head” and two “shoulders” – the left and the right shoulder.
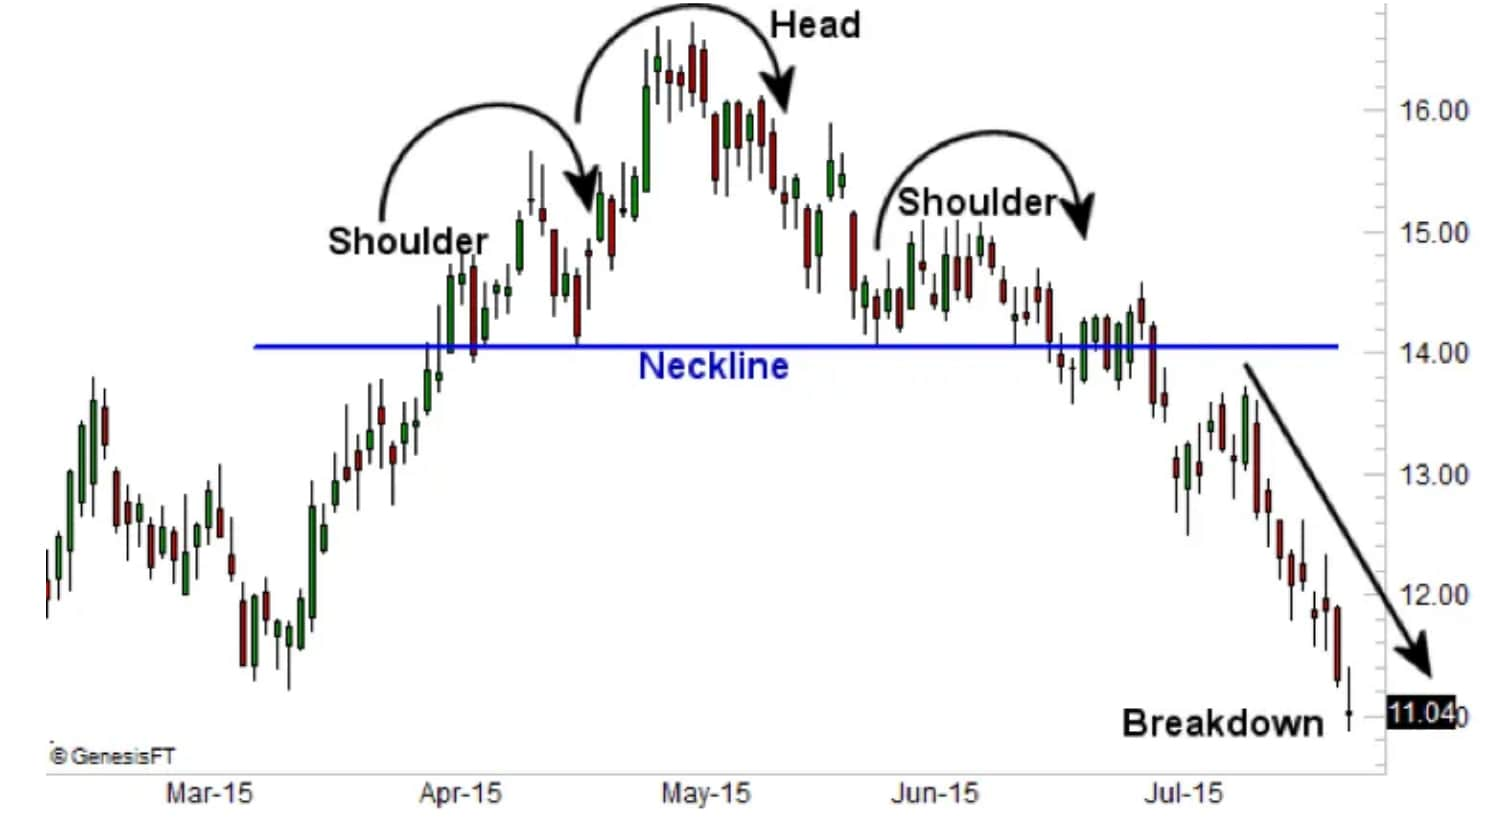
Overall, the pattern is comprised of four main parts and is formed as follows:
- The first shoulder forms when the prices rise and decline into a trough after a bullish period;
- After prices start to rally again and reach higher than the first peak – the first shoulder – the head of the pattern is formed;
- The second shoulder forms when prices drop below the head level, rise again slightly, and decline again to another through;
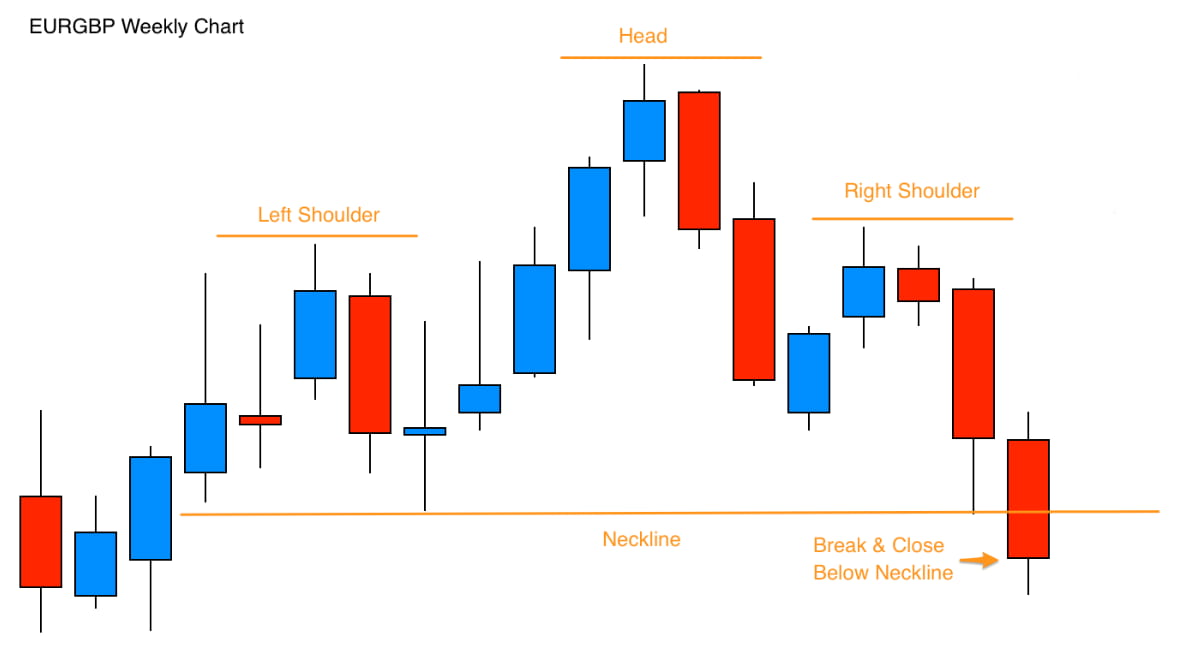
- Finally, the pattern reaches its completion and signals a market reversal when the prices decline again and drop below the neckline – a level of either support or resistance.
Support and resistance are two main concepts in technical analysis that help traders decide on the best price to buy or sell stocks. Support is the lowest price a stock tends to trade at due to the concentration of demand, and resistance is the highest due to the concentration of supply.
A neckline on the chart is a horizontal line connecting both throughs. The price move below the neckline shows a breakout of the pattern, which indicates that prices are anticipated to drop compared to the previous uptrend.
It is important to note this pattern is almost never perfect, and there will be price fluctuations between the two shoulders as well as the head – meaning that the formation is rarely perfectly shaped as described.
Best Crypto Exchange for Intermediate Traders and Investors
-
Invest in cryptocurrencies and 3,000+ other assets including stocks and precious metals.
-
0% commission on stocks - buy in bulk or just a fraction from as little as $10. Other fees apply. For more information, visit etoro.com/trading/fees.
-
Copy top-performing traders in real time, automatically.
-
eToro USA is registered with FINRA for securities trading.
Types of head and shoulder patterns
There are many variations of the head and shoulders chart pattern, all of them are quite similar to one another yet indicate various price movements.
The inverse head and shoulders pattern
The inverse head and shoulders pattern, also known as a reverse head and shoulders, follows the same structure but is flipped. Instead of a bullish-to-bearish trend, it indicates a bearish-to-bullish direction where a downward trend is about to reverse as higher lows form.
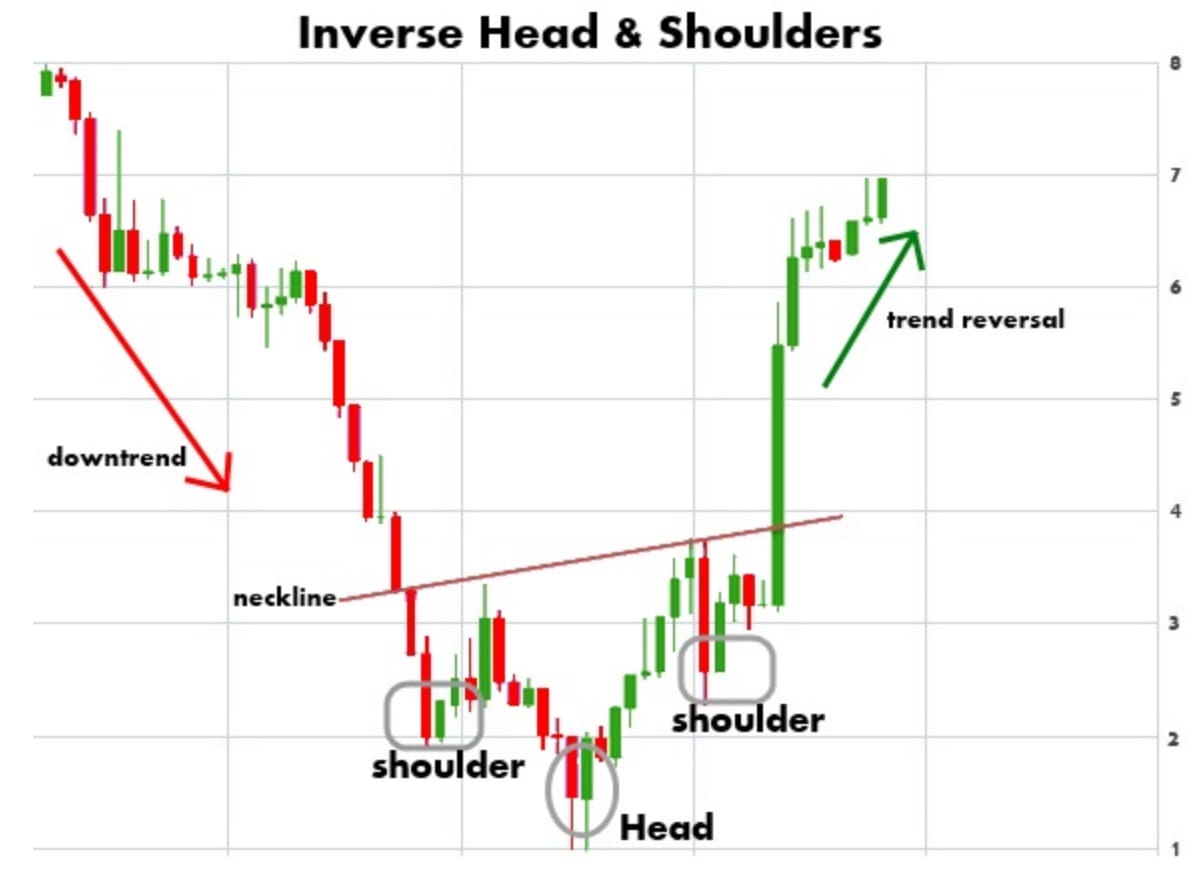
In simple terms, where the standard head and shoulders pattern indicates that increasing prices are about to start going down, the inverse formation shows decreasing prices over a period are about to rise again.
The inverse head and shoulders chart formation is as important and equally applicable to stock and trade analysis as it indicates price logic and trends and follows the same approach.
Similarly, traders can draw a neckline between the shoulders and the head – the two peaks between the low points- showing that prices are likely to rise.
The complex head and shoulders pattern
The complex head and shoulders variation isn’t as straightforward as its pure or inverse forms, as it includes other aspects. Instead of one shoulder on each side of the head, double shoulders form either side.
It also means that the trend is slightly harder to spot and that it could take longer to turn from one direction to the other. Although more complicated to identify, this pattern does have the same capabilities for forecasting price movements.
The failed head and shoulders pattern
It is possible that even if the head and shoulders chart pattern follows through, it might still fail, and the trend reversal isn’t guaranteed. The price might not follow through with the change in the trend, and sometimes the original trend could still resume.
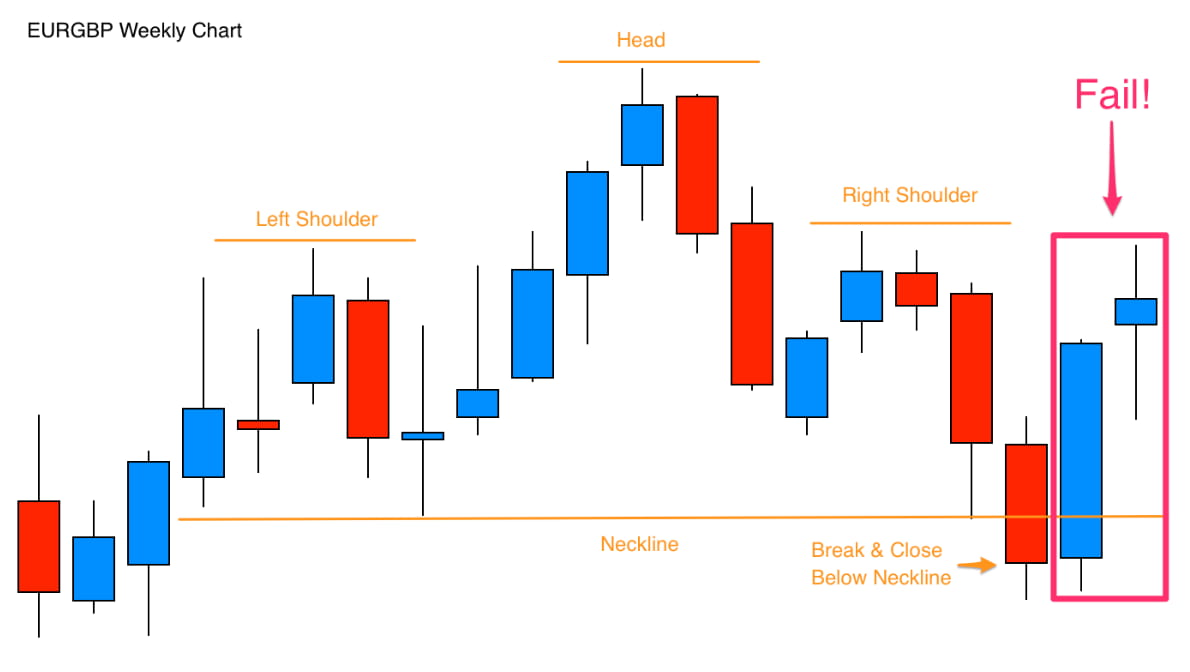
Look out for if the price goes back over the neckline, which shouldn’t happen once the neckline is already broken. It is the primary indicator that the trend reversal might not be as strong as it could be.
What does the head and shoulders pattern show?
The head and shoulders pattern is helpful for traders as it allows them to identify estimated price targets and makes it easier to place stop-loss orders. Once the pattern completes itself and the neckline has been broken, traders can determine profit and price targets.
A stop-loss order exists to limit losses, where an order is placed with a broker after the stock reaches a specific price. For example, if an investor buys a stock at $40, and the price goes down more than 10%, the loss is limited to only a maximum of 10%.
When using the head and shoulders pattern to indicate when to enter or exit a trade, it is essential to wait until it is complete as it might not develop fully in the future. Therefore, even though keeping an eye on partial or nearly fully developed patterns is beneficial, no trades should be placed before a full pattern completes.
With an inverse trend, stops are placed below the low price at the top of the head, and with the peaking head and shoulders pattern, stops are above the high price at the top of the head.
The head and shoulders pattern profit and price target
To know how much prices are expected to increase above or drop below the breakout level, it is necessary to calculate the profit and price targets.
- The profit target is the assumed maximum amount a trade will reach, at which an investor will exit the trade for an optimal gain. It is a vertically measured distance between the highest price – top of the head, and the lowest price – the neckline, to determine the price difference or spread amount between the two.
- A price target is a projection of a security’s price in the future; in this case, an estimation of how low the price will go after a neckline is broken. It is calculated by subtracting this difference from the neckline breakout level, which is the price of an asset once it moves below the support (for regular head and shoulders), or above the resistance (for inverse head and shoulders) levels.
For example, in the case of a head and shoulders top pattern, let’s assume the distance between the top of the head and the neckline is $10. Then, when the neckline breaks, it is assumed the stock price will decrease at least another $10 below the neckline. An estimate, however, is often regarded as the generally trusted number.
For an inverse chart pattern, the opposite applies – a vertical distance from the top of the head up to the neckline would indicate how high prices are likely to reach.
The most common entry point for a trade is when the price is at its breakout point, and the most efficient entry point would be waiting for a pullback to the neckline after it has already occurred. However, that requires more patience, as investors might miss the trade altogether if the price keeps moving past the breakout direction:
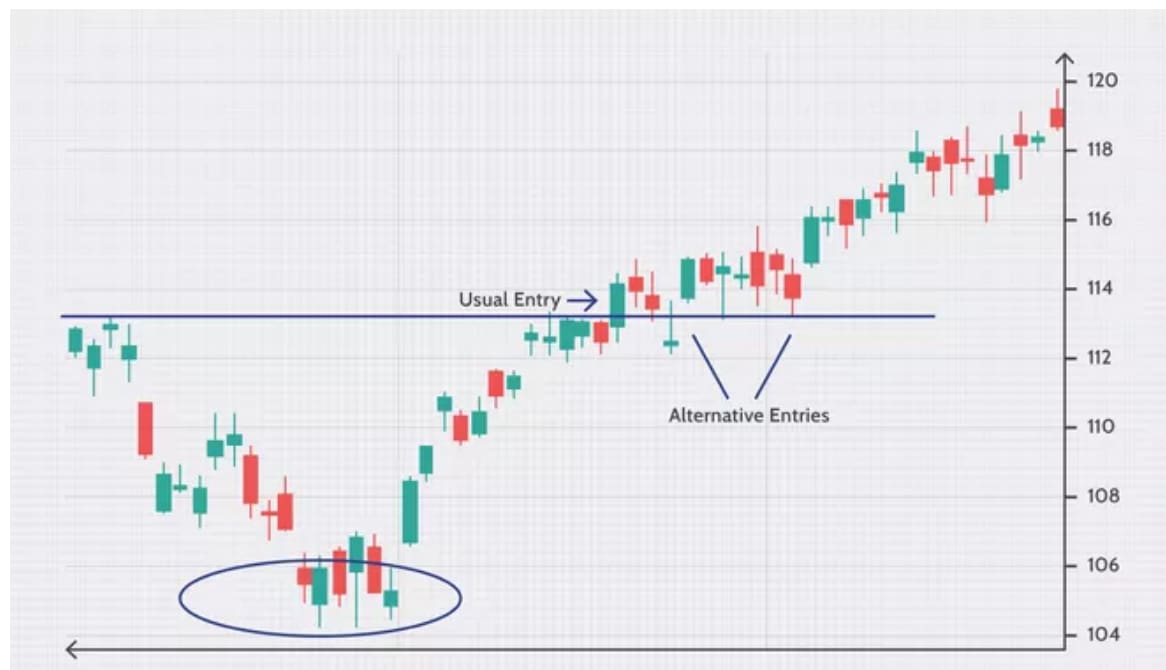
An upside breakout signals that traders can take a long position – purchase stocks at a low price to sell high, and a breakout to the downside shows a possibility to take a short position – sell stocks to repurchase them at a lower price later.
Confirming signals of the head and shoulders pattern
Noting down your entry and profit targets or any other variables that might affect the trade is advised, as it helps to plan. A large part of trading profitably is defining the potential risk and reward, as some trades don’t offer enough profitability to make it worth executing.
What is more, even if the price of a stock crosses the neckline, a trend in that direction isn’t necessarily guaranteed, and you can consider some other helpful factors that can help to confirm the trend:
Volume
The number of shares trading, and trading volume, is one of the most vital indicators for confirming the pattern’s strength. However, it is more critical for an inverse head and shoulders formation, as prices are increasing and volume has to be higher to make prices rise, showing buyers are pushing it up.
With a topping head and shoulders pattern, the trading volume starts to decrease as the price moves up toward the head, and when it rebounds and forms the second shoulder – the lower trading volume shows limited investor interest and enthusiasm.
Secondly, a spike in volume when the price moves below the neckline shows more intense selling pressure. If these two indicators aren’t showing, it can be a sign the price decline trend isn’t as strong as it could be; however, this isn’t definite.
With an inverse head and shoulders pattern, trading volume is even more significant for validating the pattern trend. You want a considerable volume behind trades if the prices increase to show the possibility and strength of a new potential bull trend.
In case of an inverse pattern, the trading volume should increase when rising from the head and even more when the price has broken through the neckline to confirm there’s significant power for prices to keep moving in a new direction.
Time frame
Another common rule is the time frame of the pattern, as profitable trend reversals need strong trends. So whether you are looking for intraday opportunities or longer ones, the price uptrend should be at least twice the length as the distance between the shoulders – it makes it more likely a trend reversal will be significant enough to trade.
Support and resistance levels
Besides volume and time frame, there can be other factors involved that can help confirm and determine the strength of the pattern. For example, traders can look at past support and resistance levels; if the price target is close to the previous support level, the support level might be a more accurate indicator.
Fibonacci retracement levels
The reliability of the head and shoulders pattern can be further validated by Fibonacci retracement levels – horizontal lines indicating where support and resistance levels are likely to occur.
Fibonacci retracement levels include ratios of 23.6%, 38.2%, 61.8%, and 78.6%, a non-official ratio of 50% is also often used. By connecting two relevant price points on the chart, these numbers can provide insight into whether the price will stall or reverse, designed to help predict future price movements.
Pros and cons of head and shoulders pattern
Even though the head and shoulders pattern doesn’t offer guarantees as a substantial part is a personal interpretation, it is one of the most popular chart formations for a number of reasons with its pros and cons.

Pros
- Pattern with a high probability for forecasting a trend reversal;
- Helpful in estimating profit and price targets and risk levels;
- Relatively easy to identify to be used by beginner and experienced traders;
- Benefits from market shifts;
- It can be applied to several markets.

Cons
- Chart formations, including head and shoulders, can be subjective;
- The likelihood of occurrence is different for different time frames;
- Interpretation – neckline can also take the form of trendlines;
- Confirming the changing trend could be difficult for beginner traders as the price can still shift at the neckline;
- Risk and reward might not be advantageous.
In conclusion
To avoid common investing mistakes, it is important to remember there are countless probabilities to trends and patterns in technical analysis, and they don’t always form to precision.
However, even though no chart pattern is always 100% accurate to signal a trend change, the head and shoulders pattern has been historically reliable and one of the easiest to recognize chart formations as well as a helpful indicator for profitable trades.
Disclaimer: The content on this site should not be considered investment advice. Investing is speculative. When investing, your capital is at risk.
Head and Shoulders Pattern FAQs
What is a head and shoulders pattern?
The Head and shoulders pattern is a chart formation used in technical analysis, commonly for price speculation when trading stocks, forex market, or cryptocurrencies. This trend appears on the chart as three peaks: a higher middle peak – the head, and two lower side peaks – the shoulders, serving as an indicator for a bullish-to-bearish trend reversal.
What is an inverse head and shoulders pattern?
An inverse head and shoulders pattern is a chart formation used in technical analysis. It is the opposite of the head and shoulders top pattern – the same chart formation but in reverse, indicating a bearish-to-bullish trend reversal instead.
What does a head and shoulders pattern mean?
The head and shoulders pattern allows investors to estimate price targets for trade entry and exit, making it easier to place a stop-loss order. After the head and shoulders pattern completes, investors can determine profit and price targets.
Is the head and shoulders pattern bullish or bearish?
The head and shoulders top pattern is bearish, indicating prices could be reversed and trending down again. In contrast, the inverse or reverse head and shoulders pattern is bullish, showing a downward trend is about to change as prices start to climb up again.