
A cryptocurrency analyst has suggested that XRP is flashing signs of an impending major price move, with a technical indicator pointing to a potential breakout after weeks of subdued trading.
In particular, Bollinger Bands (BB) on XRP’s four-hour chart have narrowed to their tightest levels since August, suggesting that volatility is contracting ahead of a possible sharp move, according to insights shared by Ali Martinez in an X post on November 2.
The last time the bands reached similar levels of compression, XRP rallied approximately 71% in just three days.
Advertisement
While the historical pattern raises the prospect of another significant move, the indicator does not establish whether the next breakout will be bullish or bearish.
According to Martinez, a four-hour candle close above $1.27 would provide bullish confirmation, while a close below $1.23 would signal growing downside pressure. Until either level is breached, the $1.23 to $1.27 range remains a key consolidation zone.
XRP network growth provides a positive signal
Meanwhile, on-chain data points to improving network activity despite the cryptocurrency’s price weakness.
Data from blockchain analytics platform Santiment shows that the XRP Ledger recorded 7,934 newly created wallets on November 1, marking its sixth-highest daily network growth reading of 2026.
The increase is notable because November 1 fell on a Sunday, when cryptocurrency network activity typically tends to be quieter.
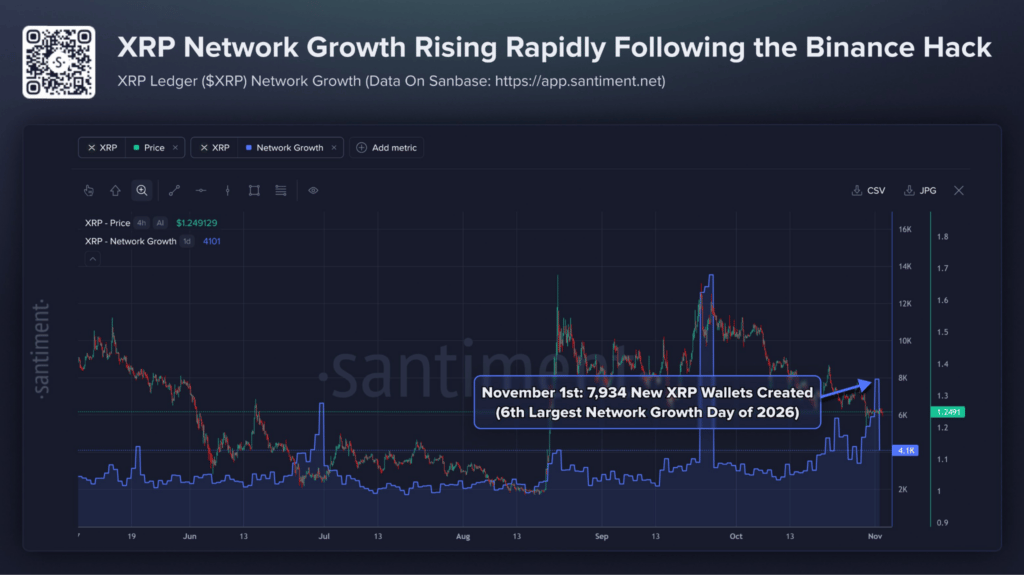
The surge also followed an eventful week for the cryptocurrency market, including the Binance hack, which may have encouraged some users to move funds into self-custody wallets.
Advertisement
The growing wallet count suggests that interest in the XRP Ledger is strengthening even as its native token struggles to regain higher price levels.
For the immediate outlook, $1.25 remains an important pivot, while reclaiming $1.30 would provide an additional indication of improving bullish momentum.
Sustained daily network growth above approximately 4,000 new wallets, combined with a recovery above $1.30, would strengthen the positive outlook.
XRP price analysis
By press time, XRP was trading at $1.25, having gained about 0.5% in the past 24 hours. However, the cryptocurrency remained down more than 3% over the past week.
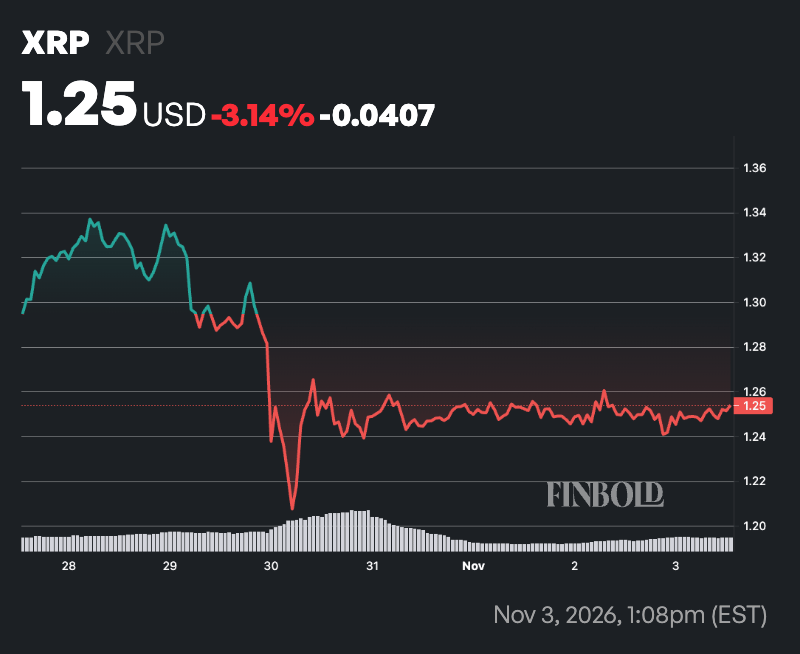
The cryptocurrency is also trading below both its 50-day simple moving average (SMA) of $1.39 and its 200-day SMA of $1.27, indicating continued bearish pressure. The 50-day SMA is significantly higher than the 200-day average, reflecting the weakness in its recent price performance.
Meanwhile, the 14-day Relative Strength Index (RSI) stands at 36.62, indicating weak buying momentum but remaining above the oversold threshold of 30. This suggests that XRP has room for further downside before entering oversold territory.
Featured image via Shutterstock