Shares of leading chipmaker AMD (NASDAQ: AMD) have experienced a striking resurgence in 2023, aligning with the broader resurgence of the tech market.
This resurgence is primarily fueled by the ongoing artificial intelligence (AI) boom, in which AMD plays a pivotal role as one of the select few companies specializing in high-end graphics processing units (GPUs) essential for powering this cutting-edge technology.
Bolstered by soaring demand, AMD’s Q1 and Q2 earnings and revenues exceeded expectations, generating a positive investor sentiment and propelling the stock to an impressive year-to-date surge of 70%.

Meanwhile, in its Q2 earnings report, the semiconductor company said its client segment sustained a significant decline due to a weak PC market. In addition, AMD issued a Q3 sales forecast that fell short of Wall Street’s estimates, injecting a dose of uncertainty regarding the stock’s performance for the rest of 2023.
In this light, Finbold turned to quantitative analysis and AI algorithms to forecast AMD’s price and where it could stand by the end of the year.
According to the AI-powered prediction tools on CoinCodex, shares of AMD are projected to trade at $87.39, according to data retrieved on October 11. That is roughly 20% lower than AMD’s current stock price of $109.01
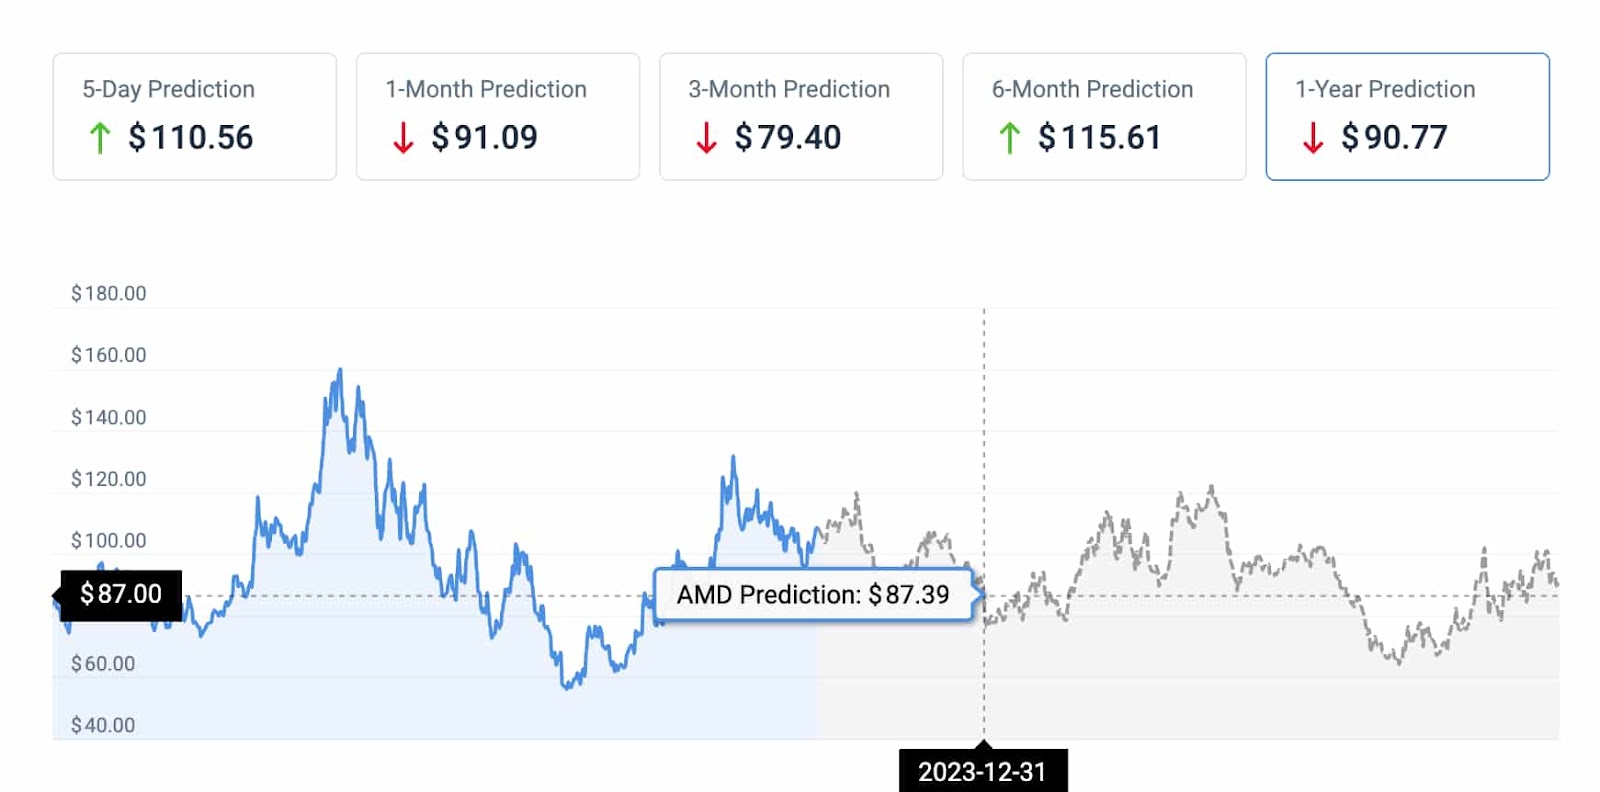
In the near term, the algorithms expect AMD to be around $91.09 one month from now. Looking further ahead, CoinCodex’s 1-year price estimate sits at $90.77.
AMD technical analysis
Coming to the technical analysis of the stock, AMD’s current stock market performance paints a mostly bullish picture.
The stock registered 17 green days in the past 30, with a price volatility of just 3.63% during that period.
At its last closing price of $109.01, the stock is facing a resistance at $110.75 – where the 100-day simple moving average (SMA) is located.
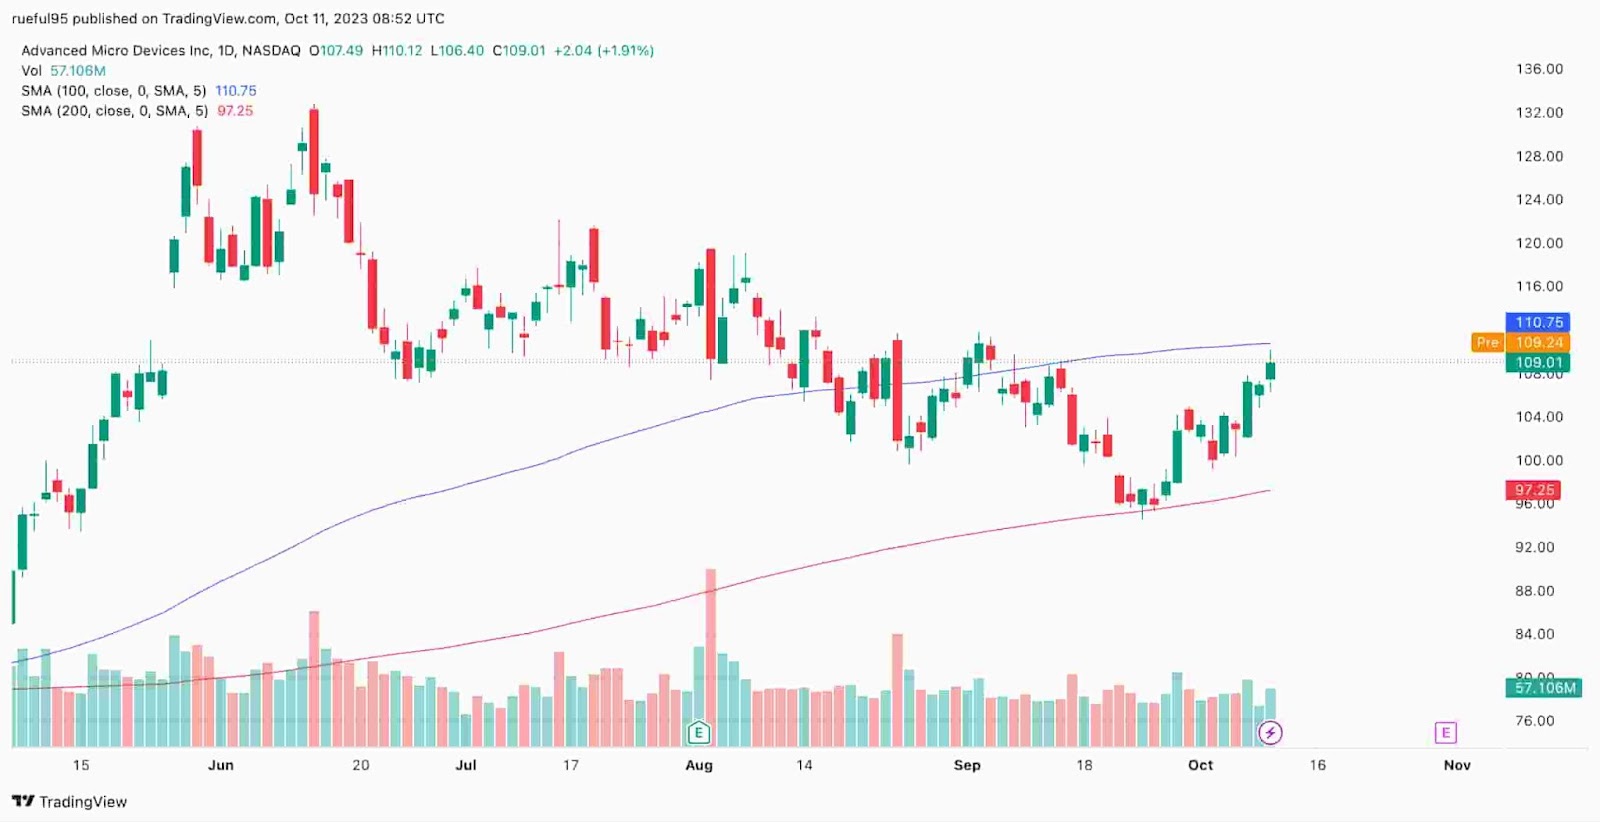
On the downside, a support zone sits in the range of $99.7 to $99.2, followed by another support at the 200-day simple moving average of $97.25.
Buy stocks now with Interactive Brokers – the most advanced investment platform
Disclaimer: The content on this site should not be considered investment advice. Investing is speculative. When investing, your capital is at risk.