Amid market-wide consolidation and stagnation in the cryptocurrency sector, some assets have stood out in their on-chain activity, including the pure proof-of-stake (PoS) network Algorand (ALGO), which has been adding active addresses at a time when most cryptos have been idle or even declining.
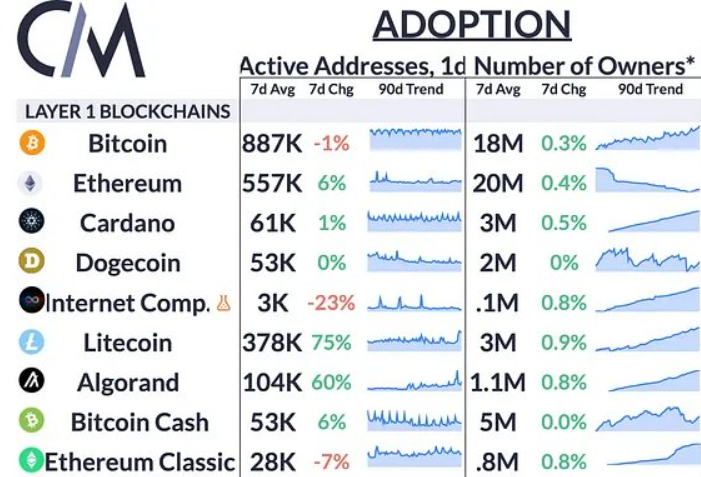
Indeed, Algorand has shown strong growth week-over-week, with ALGO daily active addresses rising as much as 60%, according to the data assembled by crypto market analytics company CoinMetrics and published on October 18.
As data demonstrates, Algorand’s seven-day average is 104,000 active addresses, second only to Litecoin (LTC), which increased the amount of its on-chain activity by 75%, with an average of 378,000 daily active addresses.
Lack of activity across landscape
By comparison, Ethereum (ETH) and Bitcoin Cash (BCH) both advanced their on-chain activity by only 6% (557,000 and 53,000), whereas Ethereum Classic (ETC) and Bitcoin (BTC) declined by 7% (28,000) and 1% (887,000), respectively.
The biggest ‘loser’ in the group was the open-source blockchain network Internet Computer (ICP), which declined by 23% week-over-week, having only 3,000 daily active addresses.
In terms of other types of digital assets, ICP is joined on the bench by stablecoin Gemini Dollar (GUSD), which lost 32% on its weekly on-chain activity, featuring fewer than 1,000 active daily addresses.
Algorand price analysis
Meanwhile, Algorand’s token was at press time trading at $0.3143, representing a decline of 2.38% over the previous 24 hours, as well as 1.50% compared to seven days before.
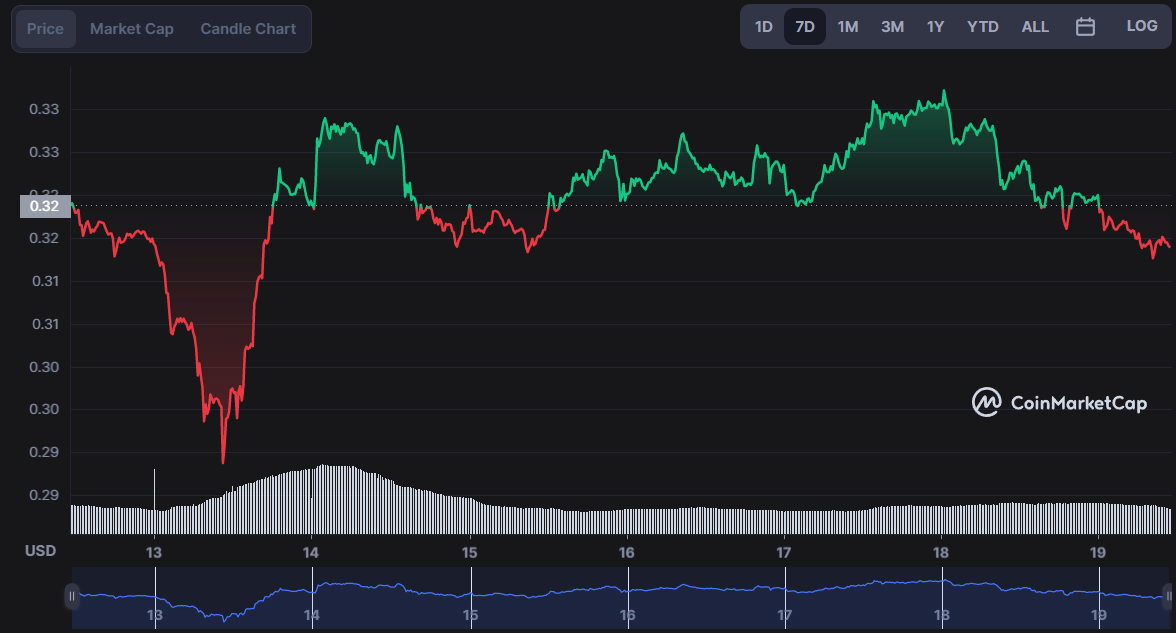
At the same time, ALGO’s market capitalization currently stands at $2.20 billion, making it the 30th-largest cryptocurrency by this indicator, as per CoinMarketCap data retrieved by Finbold on October 19.
ALGO technical analysis
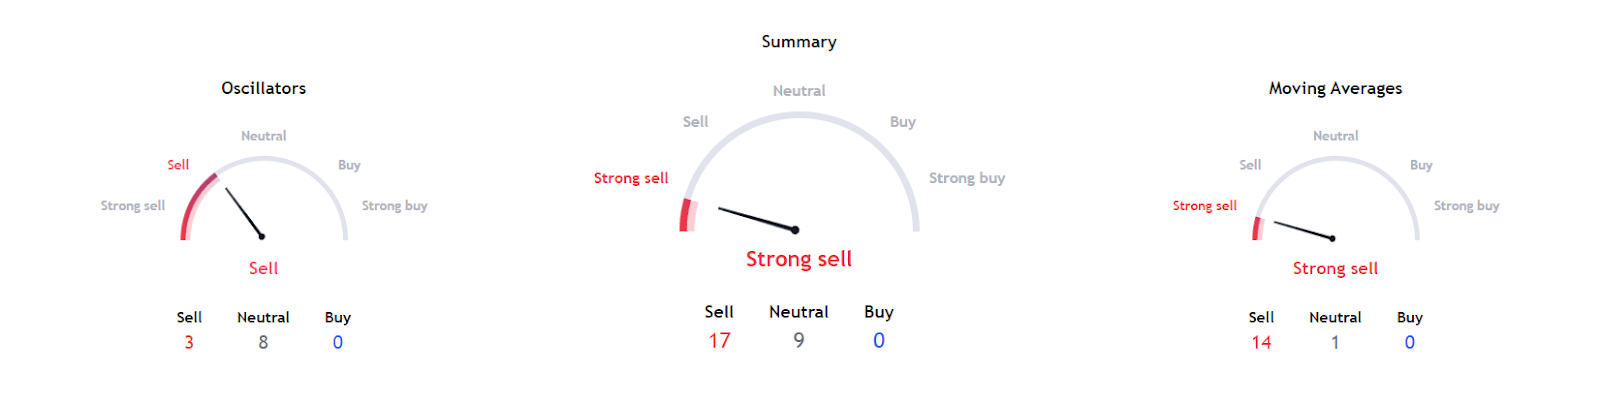
That said, despite strong fundamentals, short-term technicals look sloppy for ALGO, as the summary of one-day technicals demonstrates a strong sell sentiment at 17, while nine are showing neutrality.
Further breakdown of the technical analysis shows oscillators suggest selling ALGO at three while eight are expressing neutrality. As far as moving averages (MA) are concerned, technicals are currently pointing to a strong sell at 14, while only a single one is demonstrating neutrality.
In the meantime, ALGO is trading both below the 100-day and 200-day moving averages, indicating increased selling pressure on the decentralized finance (DeFi) token and an advantage for bears should it break down the support.
Disclaimer: The content on this site should not be considered investment advice. Investing is speculative. When investing, your capital is at risk.