
As Solana (SOL) moves to maintain its price above the $160 support zone, a crypto trading expert has pointed out that chart patterns indicate the token is aligning for a major breakout.
In an X post on July 19, Ali Martinez shared a bullish outlook on Solana, noting that the SOL chart was forming a ‘bull flag’—a classic chart pattern that typically signals a continuation of an upward trend.
The analysis indicated that a significant upward movement in Solana’s price started in late 2023, followed by consolidation, forming the flag pattern. This consolidation is characterized by a series of lower highs and higher lows, creating a triangular shape.
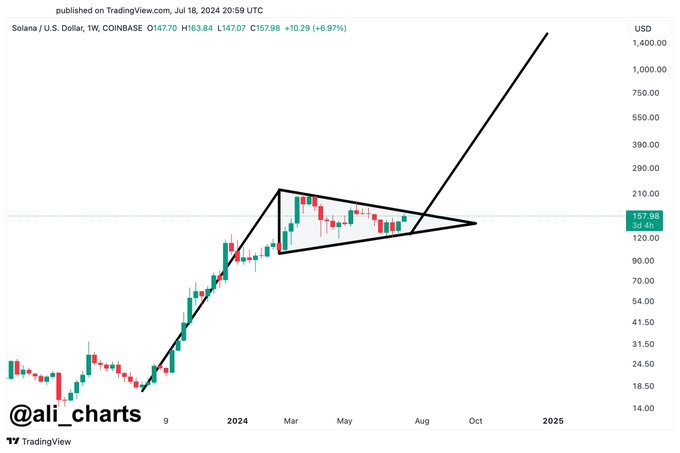
According to technical analysis, the breakout from this pattern is expected to be in the direction of the prior trend, which, in this case, is upward.
Martinez’s chart analysis signals a breakout target for Solana at approximately $1,400. This ambitious target is derived from measuring the height of the initial price surge and projecting it from the point of breakout.
Implication of Solana breakout
If Martinez’s prediction holds, this would represent a nearly 760% increase from the current price. Indeed, such a valuation would cause Solana to experience substantial buying pressure.
Therefore, if SOL hits $1,400, the decentralized finance (DeFi) token would record a market cap of approximately $651.46 billion. To put this into context, this market cap would make Solana the second-highest crypto, surpassing Ethereum (ETH), assuming minimal growth from Ethereum’s current valuation.
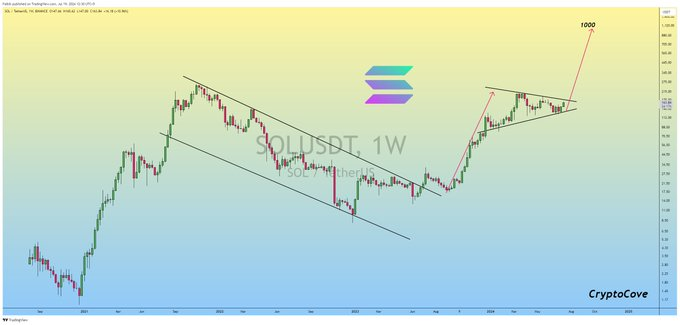
Overall, most analysts have maintained that Solana is likely to witness a bullish breakout, with many citing technical indicators. For instance, crypto analyst Captain Faibik pointed out that Solana is on the verge of a bullish pennant breakout.
The analysis indicated that Solana’s price action formed a symmetrical triangle, signaling a potential breakout from this triangle with a bullish target of around $1,000.
At the same time, amid the anticipation of trading in the Ethereum spot exchange-traded fund (ETF), speculation has turned to Solana regarding a possible similar product launch for SOL. This anticipation is partly driving the bullish sentiment around SOL.
Solana price analysis
As of the time of writing, Solana was trading at $162 with daily gains of over 2%, while on the weekly chart, SOL is up almost 20%.
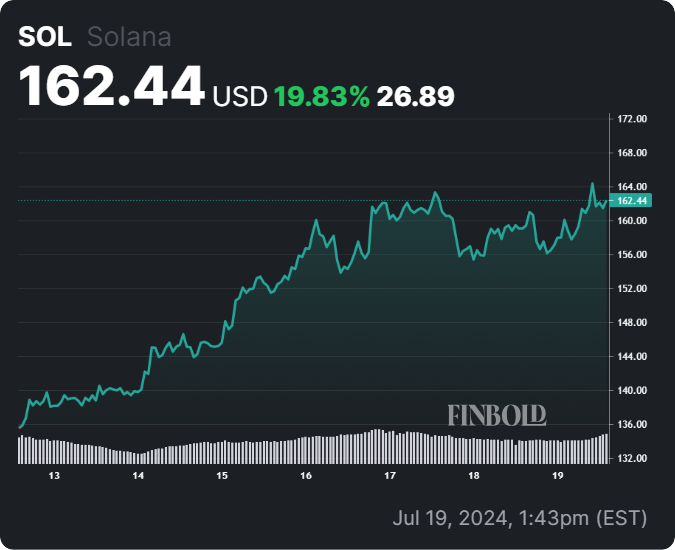
Overall, amid the bullish projections for SOL, the main hurdle remains to sustain the $160 support base, as it could anchor any rally towards the long-term target of $200.
Disclaimer: The content on this site should not be considered investment advice. Investing is speculative. When investing, your capital is at risk.