
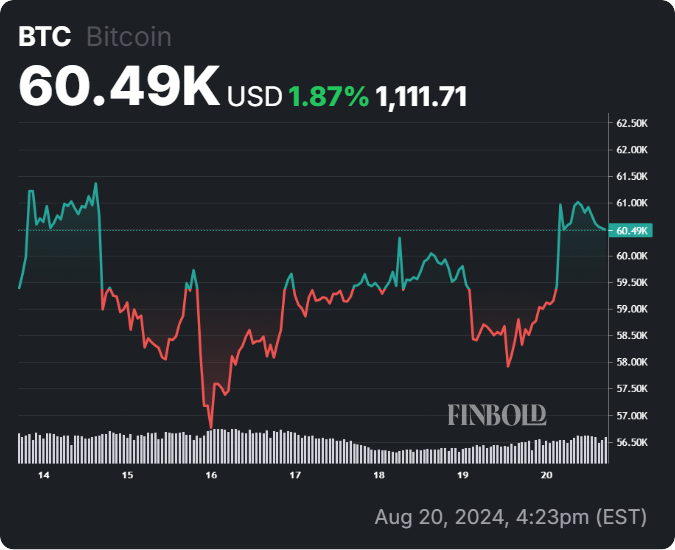
Bitcoin (BTC) bulls have taken control of the cryptocurrency in the short term, driving the asset to reclaim the crucial $60,000 resistance zone, with technical indicators hinting at the potential for further upside.
Indeed, this short-term momentum has led crypto analyst The Moon, in an X post on August 20, to point out that Bitcoin has broken free from a descending channel that had been suppressing its price for the past two weeks.
According to the expert, Bitcoin had been consolidating within this downtrend, with prices fluctuating between $58,000 and $62,000. The breakout above the upper boundary of the descending channel suggests a potential reversal of the bearish trend that had dominated the market since early August.
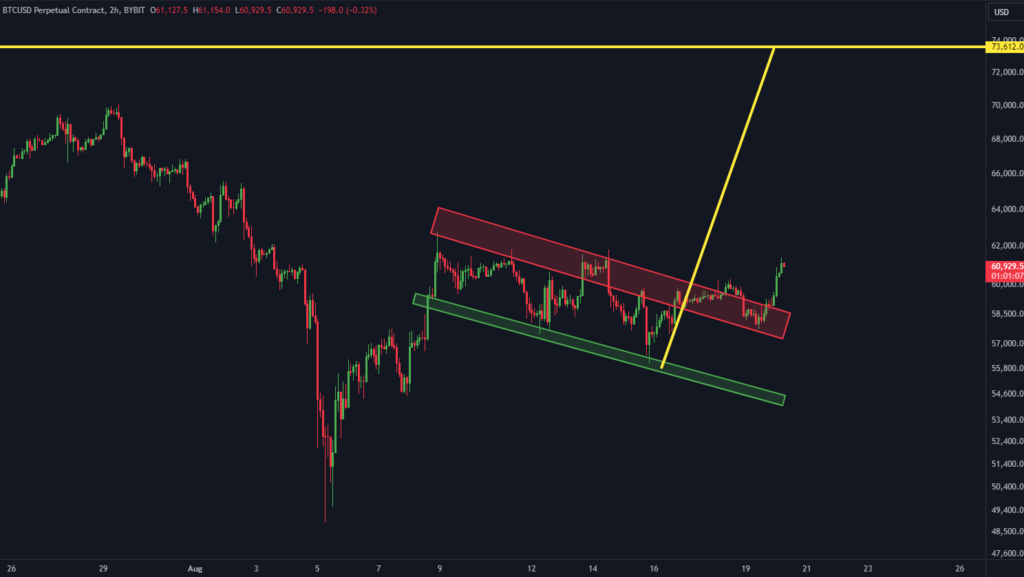
Moreover, the analysts noted that the $53,000 area has been a critical support zone for Bitcoin during this consolidation phase. Bitcoin’s price action bouncing off this support further bolsters the bullish sentiment.
The Moon’s analysis emphasized the potential for Bitcoin to reach a new all-time high, targeting the area above the $73,000 mark. If this upward path is sustained, Bitcoin could surpass its previous all-time high.
Significance of Bitcoin’s $73,000 target
It’s worth noting that some analysts view the $73,000 mark as a key level to watch in the coming days. For instance, as reported by Finbold, Bitcoin trading expert CrypNuevo noted that Bitcoin holds a mid-term bullish bias, potentially leading its price to the current all-time high of $73,000.
In the meantime, Bitcoin is seeking to validate the current bullish momentum. Crypto analyst Titan of Crypto, in an X post on August 20, identified key levels to watch for the asset.

According to the analysis, Bitcoin’s price has shown signs of strength, recently moving above the crucial Kijun line on the Ichimoku chart. This critical level is significant for traders as it often acts as a support or resistance point, influencing market direction.
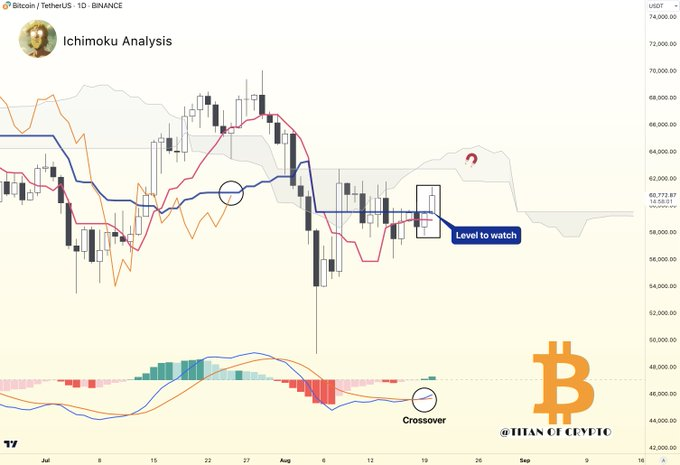
As of the latest analysis, Bitcoin is hovering close to the $59,500 mark. A daily close above this level could confirm a bullish trend, potentially leading to upward momentum. The Moving average convergence divergence (MACD) indicator also shows a bullish crossover, reinforcing the positive outlook.
Bitcoin price analysis
As of press time, Bitcoin was trading at $60,779, reflecting daily gains of almost 4%, while on the weekly chart, BTC is up about 1.8%.
With the momentum now seemingly in favor of the bulls, market participants will closely watch Bitcoin’s price action in the coming days. Should BTC maintain its upward trajectory and break past key resistance levels, the cryptocurrency could be on its way to charting new highs.
Disclaimer: The content on this site should not be considered investment advice. Investing is speculative. When investing, your capital is at risk.