
As the cryptocurrency market continues to make modest gains after a stressful period for most of its assets, Bitcoin (BTC) is no exception, and crypto experts have observed an interesting pattern that could spell a bullish future for the decentralized finance (DeFi) token.
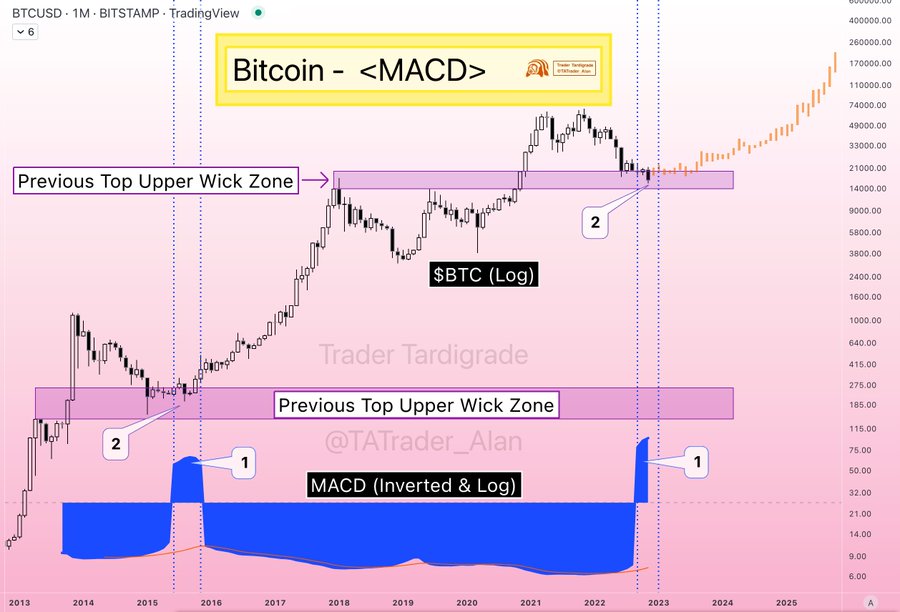
Specifically, Bitcoin is currently following a similar chart pattern as it did leading up to the previous bottom in 2015, which means that a “massive bull run” could be in store for the flagship digital asset, according to an analysis by the prominent crypto analyst Trader Tardigrade, published on November 23.
What are the similarities?
As the expert specified, two indicators stand out as the most similar: “1. Inverted and Logarithmic MACD [moving average convergence divergence] moves above zero line.” and “2. BTC falls onto the support zone, which created by upper wick of monthly candle in previous cycle top.”
In his view, the end result is that:
“Massive BULL RUN follows.”
At the same time, another pseudonymous crypto analyst, Moustache, also expressed the view that Bitcoin could be in for a bull run in the future, supported by the historical analysis that goes even further back into the past and observes the RHODL [realized value HODL waves] ratio:
On top of that, user CoinLupin at the crypto analytics platform CryptoQuant observed “a lot of people are selling at a loss,” which could indicate the bottom. However, the analyst added, “the real bottom comes when more than half of investors in the entire cycle, including this, lose money.”
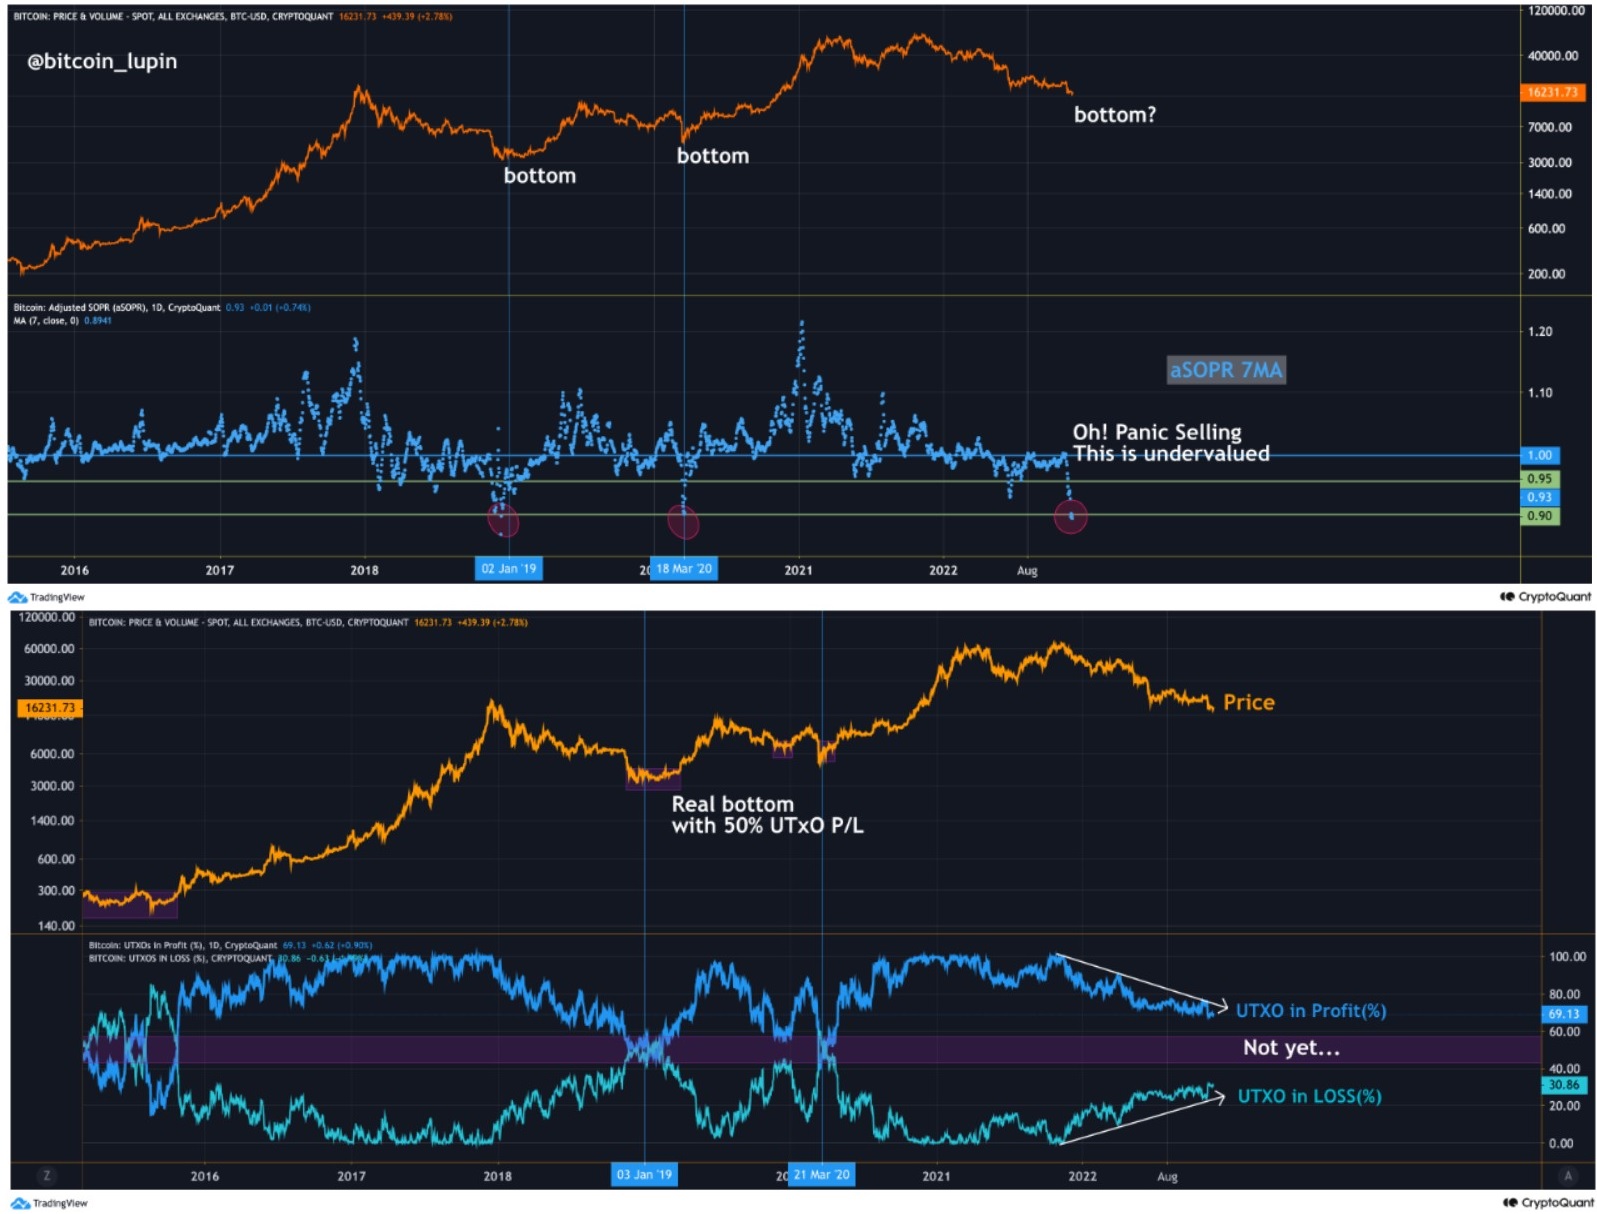
As CoinLupin concluded:
“Of course, short-term panic can cause a short-term rebound. But will it continue in the long run? I don’t know yet.”
Bitcoin price analysis
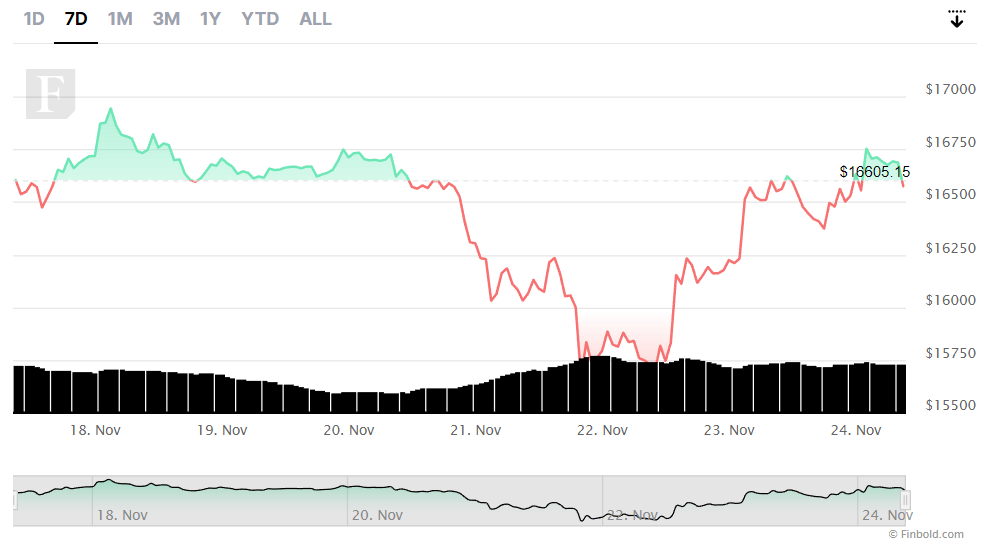
Meanwhile, Bitcoin continues to reject the crucial resistance level it needs for a bullish run toward $17,500 – $18,000, which crypto trading expert Michaël van de Poppe identified was at around the $16,600 area, as Finbold reported.
At press time, the maiden crypto was changing hands at $16,588, which represents an increase of 0.27% over the previous 24 hours and 0.08% compared to seven days before, as per data retrieved on November 24.
Earlier, technical analyst Matthew Hyland, who has been following Bitcoin’s 3-day supertrend indicator since January 2022, asserted that the token would have to reach about $20,200 to get out of the bear market.
Disclaimer: The content on this site should not be considered investment advice. Investing is speculative. When investing, your capital is at risk.