Bitcoin (BTC) remains under pressure as the maiden cryptocurrency seeks to establish a sustained price movement above the $60,000 support level.
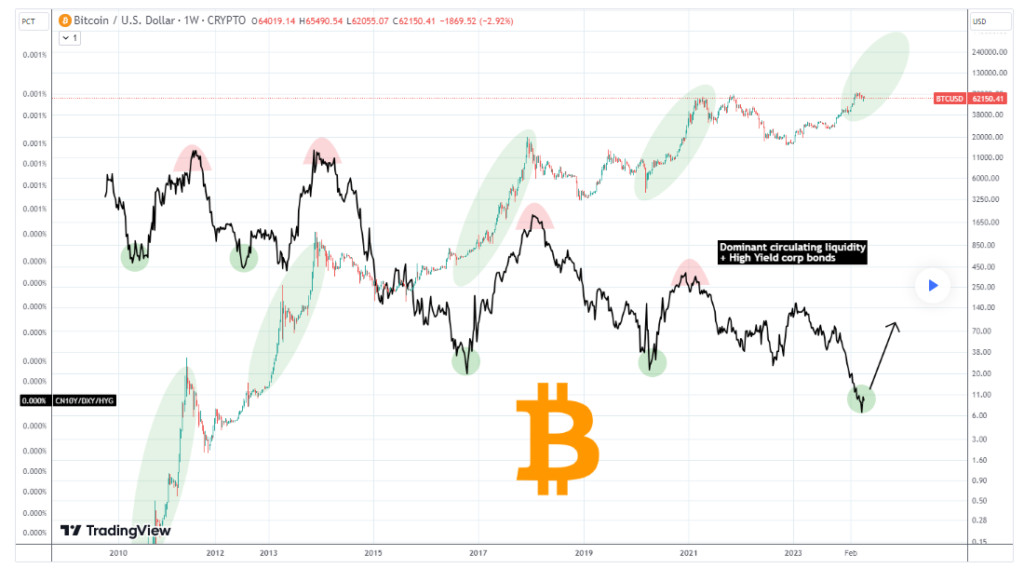
Amidst these circumstances, technical indicators suggest that Bitcoin might be on the verge of a price breakout. Particularly, in a TradingView post on May 8, crypto trading expert TradingShot drew attention to a potentially significant buy signal for Bitcoin that has largely gone unnoticed among investors.
The analysis highlighted the intersection of Bitcoin’s dominant circulating liquidity with high-yield corporate bonds. According to TradingShot, this metric has recently hit bottom and shows signs of rebounding, coinciding with consolidation or minor pullback in BTC’s price.
Picks for you
It’s worth noting that following Bitcoin’s sudden correction in early May, the crypto has gained to consolidate above $60,000, looking for a breakout towards $70,000.
What’s particularly intriguing about the buy signal identified by the analyst is its historical correlation with Bitcoin’s price action. The analysis identified previous instances in September 2016, April 2020, and April 2024 where this combination of factors occurred, signaling the start of an upward rally.
“Every time this combination took place in the past (green circles), Bitcoin was accumulating and shortly after started the parabolic rally phase (green ellipse). This is basically one of the most consistent long-term buy signals you can get in the market,” the expert said.
Bitcoin’s struggle to stay above $60,000
Amidst projections, Bitcoin is undergoing a critical test in maintaining its price above the $60,000 mark, while the $65,000 threshold looms as a crucial resistance level to monitor.
Notably, Bitcoin’s current trajectory follows a bullish rebound at the previous week’s close, marking a significant recovery from its earlier dip to as low as $56,000 in early May.
Amid these fluctuations, a segment of market participants believe that the flagship cryptocurrency remains vulnerable to further declines before potentially embarking on a bullish trajectory reminiscent of the post-halving rallies.
For instance, as reported by Finbold, crypto analyst Plan B has forecasted that Bitcoin could reach $100,000 in the latter half of 2024. He emphasized that May 2024, the final month before the next halving cycle, could catalyze the forthcoming rally.
Bitcoin price analysis
By press time, Bitcoin price today was trading at $60,250, having undergone a correction of over 2% in the last 24 hours. On a weekly basis, BTC has surged by almost 6%.

Meanwhile, should bulls falter in maintaining Bitcoin’s price above $60,000, it could spell trouble for the cryptocurrency. Such a scenario would pave the way for a correction towards the $50,000 level.
Disclaimer: The content on this site should not be considered investment advice. Investing is speculative. When investing, your capital is at risk.