Bitcoin’s (BTC) price structure is tightening, and one key level now stands between the market and a deeper correction, according to trading expert Michaël van de Poppe.
This outlook comes as Bitcoin continues to struggle to break above the $90,000 mark following days of losses and stagnation.
According to Poppe, Bitcoin’s failure to revisit and reclaim the $92,000 region could open the door to a sharp drop toward the low-$80,000 range, an area that aligns with multiple support levels, he said in an X post on December 7.
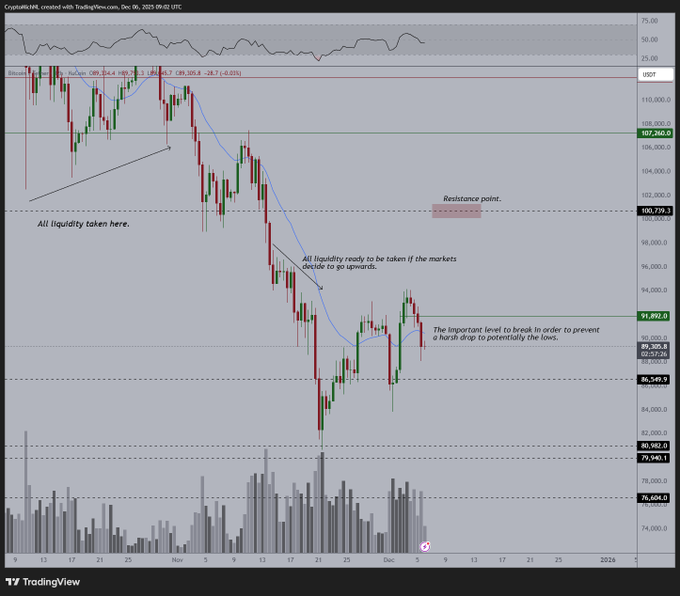
He noted that trading activity between $86,000 and $92,000 currently represents “noise,” reflecting limited directional conviction. Notably, liquidity beneath prior highs has already been taken, while upside liquidity remains stacked above the market but will only become accessible if bulls regain control.
The analysis also highlighted a major resistance band near $100,700, while the crucial downside pivot is around $89,300, a level Poppe considers essential to avoid a harsher decline.
Bitcoin price key levels to watch
If Bitcoin fails to retest or break above $92,000, he expects price action to slide toward the $80,000–$82,000 zone, where several historical support layers sit between $80,900 and $76,600. A revisit of this region could form a double-bottom pattern, potentially marking the final phase of the correction.
Despite the looming downside risk, Poppe remained optimistic about what follows. He believes Bitcoin is “not far off bottoming,” and a strong rebound from lower support could ignite a year-end rally that carries into Q1 2026.

Notably, the maiden cryptocurrency is currently consolidating as investors await the next Federal Reserve policy update. Markets are looking for clarity on how the central bank plans to approach 2026 before making fresh commitments.
Bitcoin price analysis
By press time, Bitcoin was trading at $89,411 after slipping about 0.5% in the past 24 hours, while the weekly chart shows a 2.2% decline.
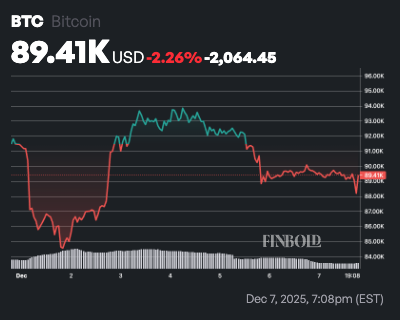
At current levels, Bitcoin sits well below its 50-day simple moving average (SMA) of $100,131 and 200-day SMA of $103,640, signaling a sustained bearish trend as the asset trades in downtrend territory without support from these key long-term averages.
The 14-day Relative Strength Index (RSI) at 43.04 remains neutral, indicating limited immediate momentum for a reversal despite growing market fear.
Featured image via Shutterstock