
Although Ethereum (ETH) has been struggling to regain the psychological threshold of $2,000 despite the recent positive momentum on the wider cryptocurrency market, its outlook might not look as bearish by the year’s turn if BlockchainCenter’s rainbow price chart for Ethereum is any indicator.
Specifically, some crypto traders and investors use Ethereum’s rainbow chart to observe the historical movements of the second-largest cryptocurrency by market capitalization in relation to various moving averages (MAs) and find patterns that could help them make better investment decisions.
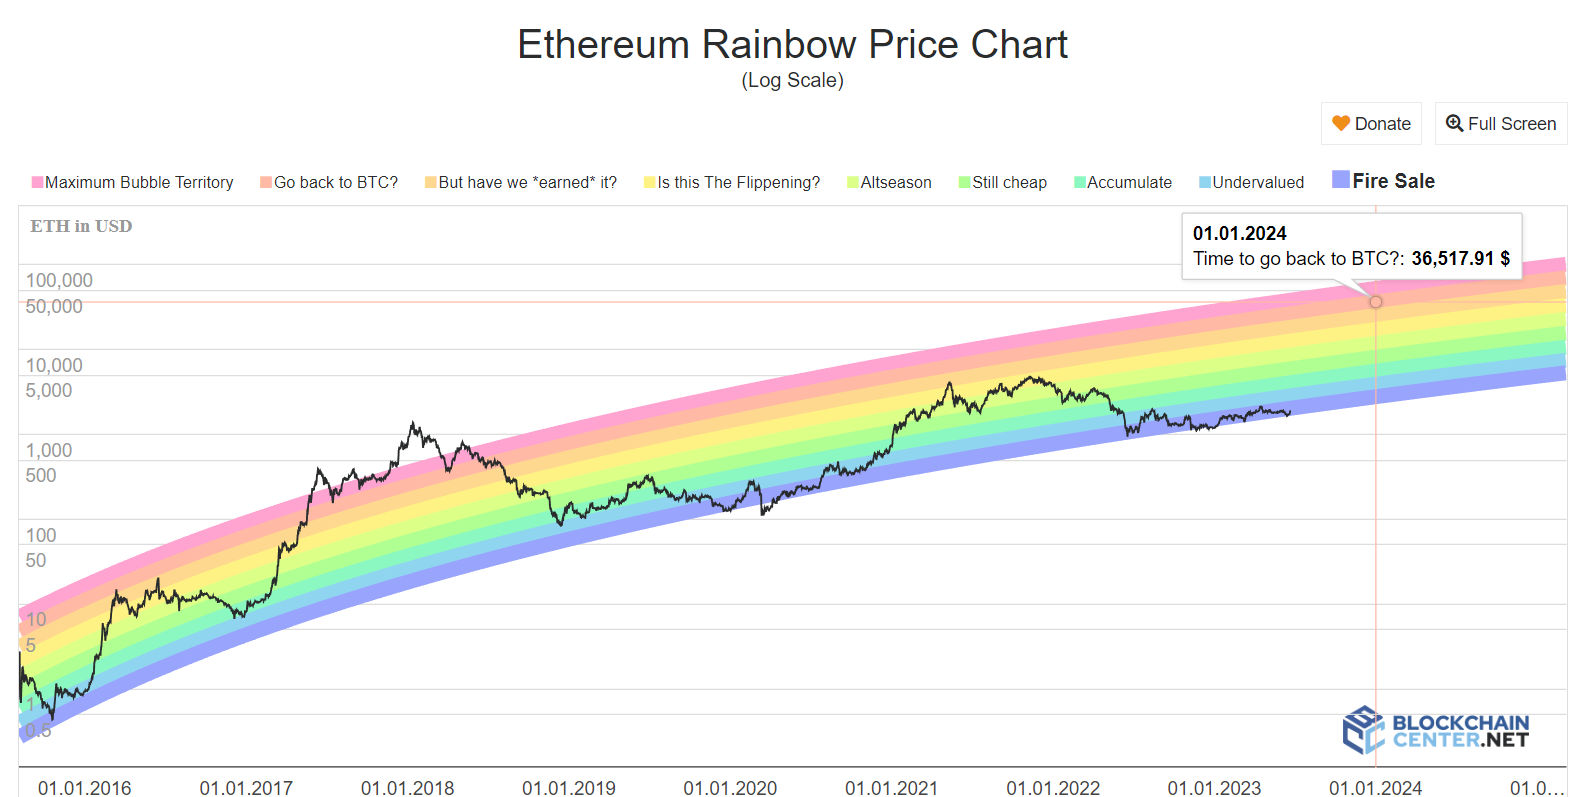
As it happens, this chart suggests that Ethereum is currently still in the ‘Fire Sale’ phase, indicated by the color purple, and ranges between $0 and $2,593, below the ‘Undervalued’ blue zone between $2,593 and $3,668, as per data seen by Finbold on June 23.
Projection for January 1, 2024
Specifically, Ethereum has been stuck in the ‘Fire Sale’ area since early October 2022, which, judging by the previous behavior, it might get out of in a matter of weeks, as the same had happened in July 20202, when ETH moved into the ‘Undervalued’ zone after a period of eight months in the ‘Fire Sale.’
Further crunching the numbers, it took Ethereum 10 months to peak at the ‘But have we *earned* it?’ level at $4,336. If the same trend occurs this time around, it would mean that the crypto asset would end up in the same zone – currently between $16,353 – $23,742, by April 2024.
In other words, seven months from now, around January 1, 2024, Ethereum could be changing hands in the ‘Still cheap’ price area on the rainbow chart, which currently stands between $5,290 and $7,705, taking into consideration the exact same pattern.
Before that action, Ethereum was in the ‘Fire Sale’ area only one time – in October 2015 – soaring to the ‘Go back to BTC?’ price level four months later, followed by a subsequent drop to the ‘Undervalued’ zone in January 2017, where it stuck around very shortly until moving up again and beyond the ‘Maximum Bubble Territory.’
Should this pattern repeat itself instead, it would mean that Ethereum could skyrocket to the ‘Go back to BTC?’ area in October 2023, at a price between $23,742 and $34,283, before dropping to the ‘Undervalued’ zone at $2,593 and $3,668 once again in January 2024.
Alternatively, another Ethereum Rainbow Chart tool developed by CoinCodex estimates that under the same scenario, the asset’s price would hover around $778 per token if ETH remained inside the ‘Undervalued’ (or ‘BUY!’) zone in January 2024.

Ethereum price analysis
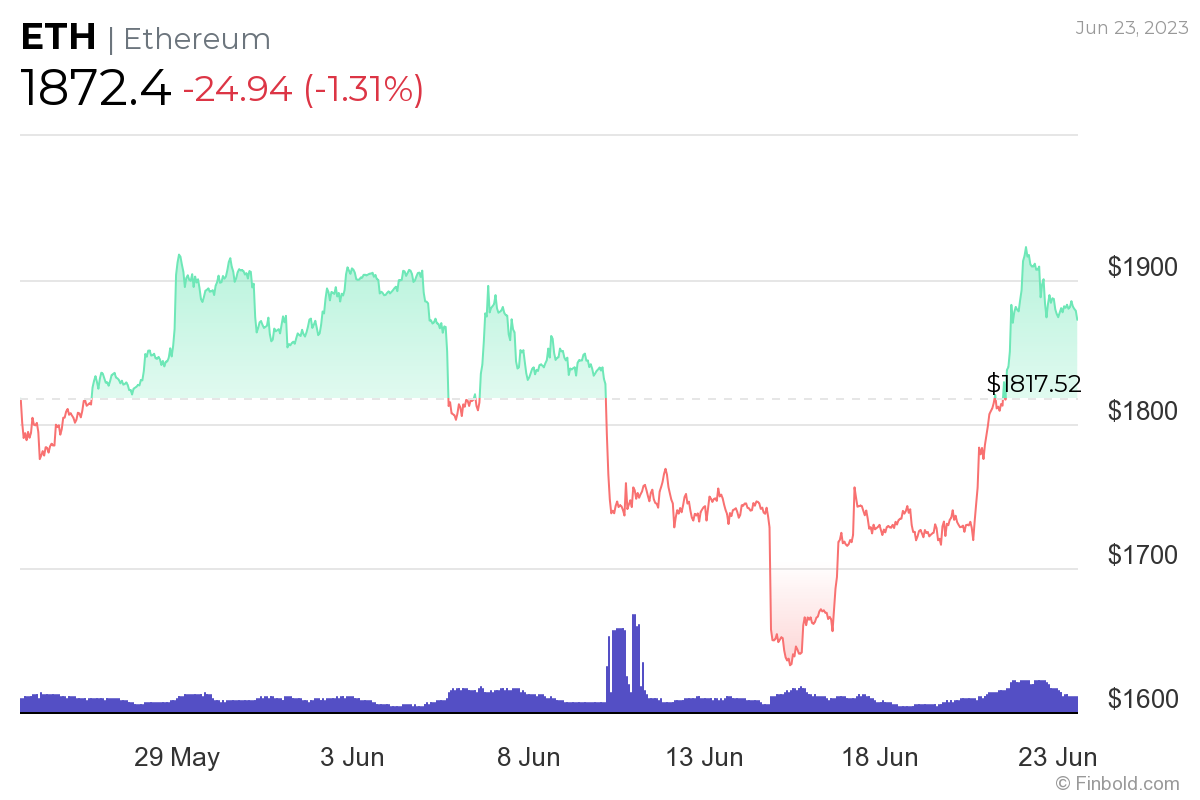
Meanwhile, Ethereum was at press time changing hands at the price of $1,872.40, recording a decline of 1.31% on the day but still an increase of 12.48% across the previous week and a 3.21% gain on its monthly chart, as per the latest data.
All things considered, whether Ethereum moves in either of the two rainbow chart patterns will depend on further developments surrounding the Ethereum network, as well as the overall sentiment on the general crypto and macroeconomic landscape.
Disclaimer: The content on this site should not be considered investment advice. Investing is speculative. When investing, your capital is at risk.