In trading, market participants use two contrasting types of analysis. Fundamental analysis examines market news, economic/social/political forces, and earnings data to predict how an asset’s price will move. Technical analysis, on the other hand, uses charts and various technical indicators to forecast market conditions. One of the essential tools used for technical analysis in securities trading is Bollinger Bands ®. Its primary incentive is to help the trader establish a trend’s direction, spot potential reversals, and monitor volatility.
The following guide will examine the indicator, what it is and what it measures, how to understand Bollinger Bands on charts and interpret those findings, as well as the pros and cons of using this technical analysis tool.
Best Crypto Exchange for Intermediate Traders and Investors
-
Invest in cryptocurrencies and 3,000+ other assets including stocks and precious metals.
-
0% commission on stocks - buy in bulk or just a fraction from as little as $10. Other fees apply. For more information, visit etoro.com/trading/fees.
-
Copy top-performing traders in real time, automatically.
-
eToro USA is registered with FINRA for securities trading.

Bollinger Bands definition
The bands contain a volatility indicator that measures a security’s relative high or low price compared to previous trades. Volatility is measured using standard deviation, which changes with increases or decreases in volatility. The bands widen when there is a price increase and narrow when there is a price decrease. Due to their dynamic nature, Bollinger Bands may be applied to various trading instruments, such as stocks, commodities, futures, and Forex.
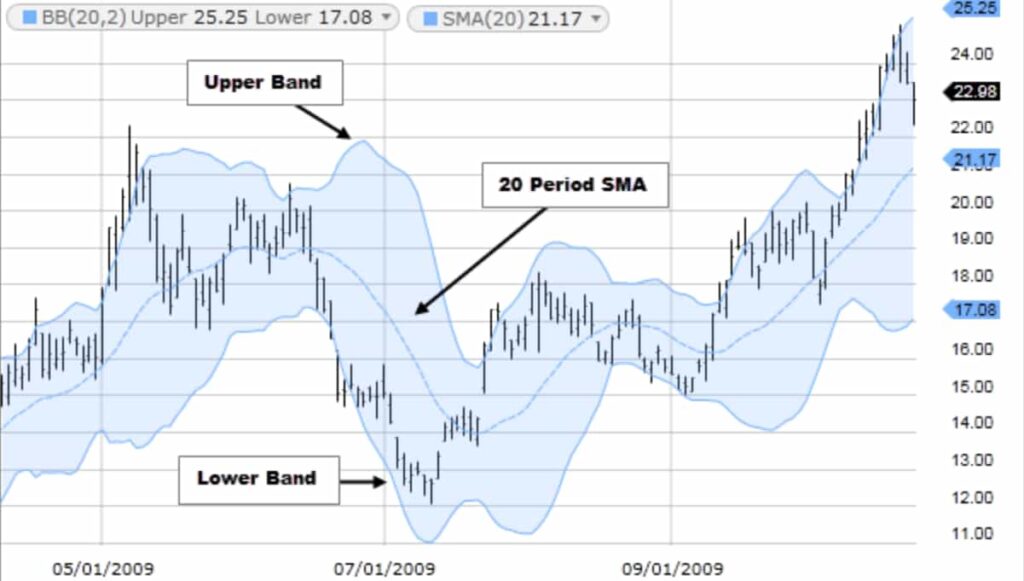
Bollinger Bands include three separate trendlines: the upper, middle, and lower band. The middle band is a moving average, and the trader chooses its parameters (most commonly the 20-day simple moving average is used). The upper and lower bands are positioned above and below the moving average band.
The trader can adjust the number of standard deviations they prefer the volatility indicator set at. Subsequently, the number of standard deviations determines the distance between the middle, upper and lower bands. The bands’ position provides information on the trend’s strength and the possible high and low price levels that may be anticipated shortly.
As Bollinger Bands offer unique insights into price and volatility, traders can find several uses for them, including determining overbought and oversold levels, as a trend-following tool, monitoring for breakouts, and deciding entry and exit points for a trade.
Bollinger Bands are a relatively simple trading tool and are incredibly popular with professional as well as at-home traders. However, using only the bands to trade is a risky strategy since the indicator focuses on price and volatility while ignoring various other relevant information.
History of Bollinger Bands
Bollinger Bands were developed in the mid-1980s by John Bollinger for trading stocks. They emerged from the demand for adaptive trading bands and the observation that volatility was dynamic rather than static, as was widely regarded back then.
The rapid acceptance of Bollinger Bands was in part due to the airing they received on the Financial News Network, where John Bollinger served as the chief market analyst from 1983 through 1990.
Bollinger Bands got their name on-air on a segment hosted by Bill Griffeth as Bollinger used a chart that depicted them. Griffeth asked what they were called as Bollinger explained their use, and unprepared, at a loss for words, Bollinger burst out Bollinger Bands. He trademarked this term in 2011.
Read also:
What is Value Investing?
What is Momentum Investing?
How to Buy and Sell Stocks?
Dividend Investing for Beginners
10 Best Stock Trading Books for Beginners
15 Top-Rated Investment Books of All Time
Bollinger Bands calculation
Bollinger Bands are composed of three lines:
- The first line is the middle Bollinger Band is a 20-day simple moving average (SMA) of the closing price. For instance, to calculate a 20 period moving average, you add up an asset’s closing prices for 20 successive days and divide that value by 20;
- The following line is the upper Bollinger Band. You calculate the upper Bollinger Band by taking the middle band and adding twice the daily standard deviation to that amount;
- The final line is the lower Bollinger Band. You calculate the lower Bollinger Band by taking the middle band minus two times the daily standard deviation.
The standard deviation measures how spread out numbers are from an average value for a given data set. Standard deviation is the square root of variance. The variance itself is the average of the squared differences of the mean (the simple average of a given set of numbers). It is a mathematical measurement of average variance and appears prominently in economics, statistics, finance, and accounting.
The Bollinger Bands formula is as follows:
- Middle band: Simple Moving Average (SMA) of the closing prices over a specified period (typically 20 days).
- Upper band: Middle Band + (2 x Standard Deviation of the price over the same period).
- Lower band: Middle Band – (2 x Standard Deviation of the price over the same period).
This formula creates the three lines that form the Bollinger Bands, with the upper and lower bands representing volatility levels above and below the moving average.
How to read and interpret Bollinger Bands
Bollinger Bands can also be inclined to provide false signals. For example, a false breakout happens when an asset’s price passes through the trade entry point. It signals a trade but then moves back in the other direction, resulting in a losing trade.
Traders should understand that standard settings will not suit all strategies when trading with Bollinger Bands. For example, long-term position traders may prefer to use a more significant number of periods and a higher standard deviation. In contrast, day traders and swing traders may use a lower number of periods and lower standard deviation. For this reason, the Bollinger Bands indicator is best utilized in conjunction with other indicators and technical analysis tools as part of a comprehensive trading strategy.
Best Crypto Exchange for Intermediate Traders and Investors
-
Invest in cryptocurrencies and 3,000+ other assets including stocks and precious metals.
-
0% commission on stocks - buy in bulk or just a fraction from as little as $10. Other fees apply. For more information, visit etoro.com/trading/fees.
-
Copy top-performing traders in real time, automatically.
-
eToro USA is registered with FINRA for securities trading.
Uses of Bollinger Bands
The following strategies are the primary uses of Bollinger Bands:
Overbought and Oversold
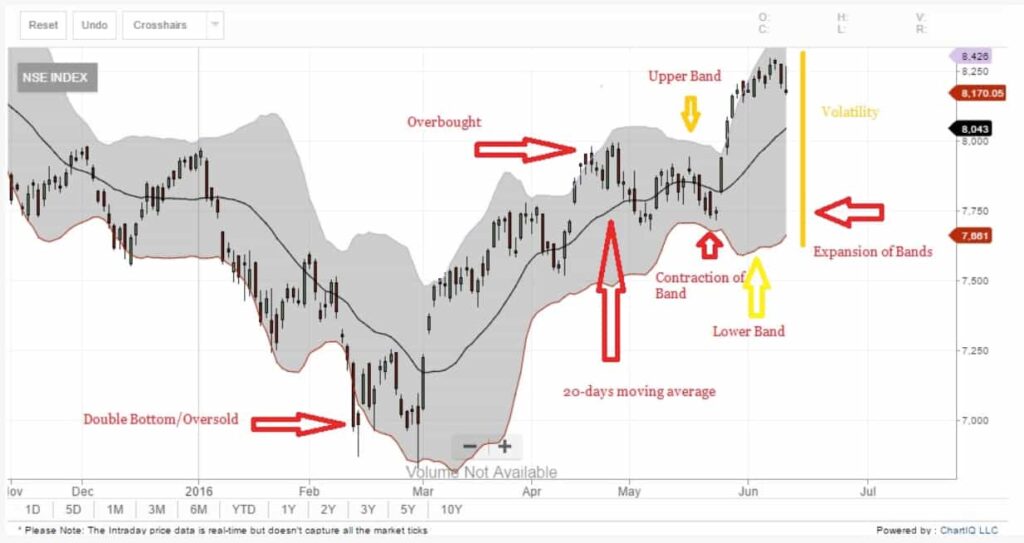
A common strategy utilizing Bollinger Bands is identifying overbought or oversold market conditions. For example, when the security’s price continually touches the upper Bollinger Band, the market is thought to be overbought and due for a sell. On the other hand, when they continually touch the lower band, the market is perhaps oversold, triggering a buy signal.
Using the bands to indicate overbought/oversold conditions depends on the concept of mean reversion of the price. Mean reversion assumes that if the price varies considerably from the mean or average, it eventually reverts to its long-term average levels. Mean reversion trading attempts to capitalize on a security’s extreme price changes, assuming it will regress to its previous state.
Mean reversion strategies can work well in range-bound markets, as prices can be seen noticeably bounce between the two bands. However, Bollinger Bands don’t always give accurate buy and sell signals. For example, during a strong trend, the trader is at risk for placing trades on the wrong side of the move since the indicator can suggest overbought or oversold signals too soon.
To fix this, a trader can look at the overall direction of the price and then only take trade signals that align them with the trend. For example, only take short positions when the upper band is tagged when the trend is down. If preferred, the lower band can still be used as an exit, but a new long position is not opened because that would mean going against the trend.
Bollinger bands squeeze
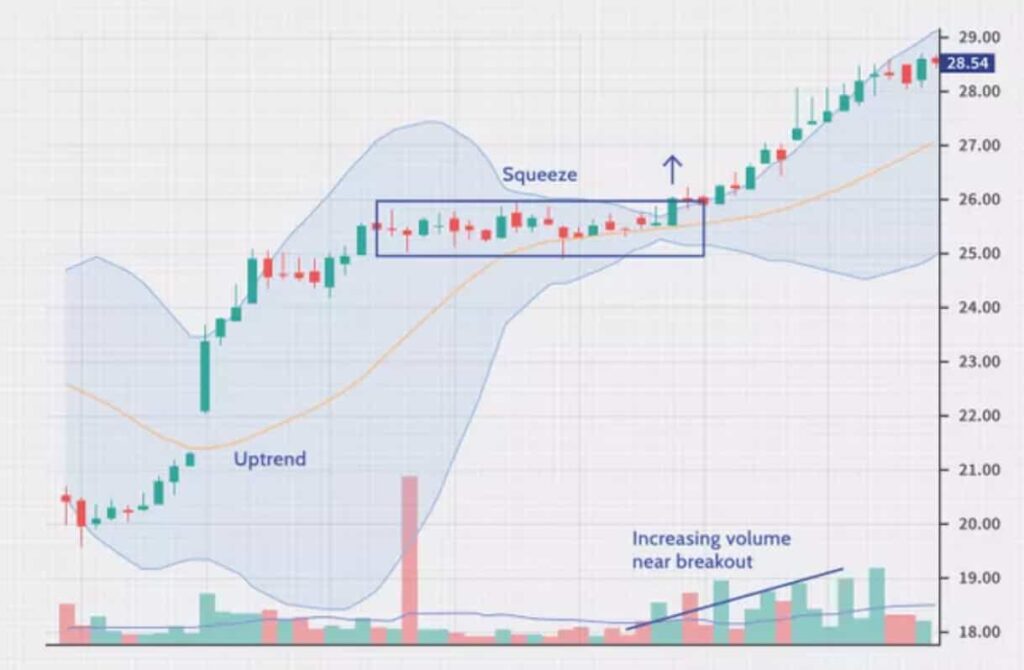
Another popular strategy to use with Bollinger Bands is called a squeeze strategy. A squeeze occurs when volatility falls to low levels, and the price starts moving sideways in a tight consolidation, narrowing the Bollinger Bands.
A trader can visually identify a squeeze when the upper and lower bands get closer together, constricting the moving average. A squeeze is a sign of decreased volatility and is considered by investors as a possible sign of future increased volatility and potential trading opportunities. Conversely, the further away the bands move from each other, the more likely the chance of a decline in volatility and the more significant the possibility of exiting a trade.
Breakouts
If there is a positive divergence: when the indicators are heading upward while the price is heading down or stays neutral – it is a bullish sign. On the other hand, if there is a negative divergence: when the indicators are falling while the price moves higher – it is a bearish sign.
A breakout to the upside signals traders to initiate long positions or exit short positions. Conversely, a breakout to the downside signals traders to open short positions or exit long positions. A stop-loss order is traditionally placed outside the consolidation on the opposite side of the breakout.
Importantly, however, these conditions should not be taken as trading signals. The bands give no signs of when the change may take place or in which direction the price might move. According to Bollinger, it is necessary to look to other indicators to determine breakout direction. He suggests using the relative strength index (RSI) along with one or two volume-based indicators such as the intraday intensity index or the accumulation/distribution index.
Day trading uptrends
Bollinger Bands help determine how strongly a security is rising (uptrend) and when it’s potentially losing strength or reversing. This data can then be used as guidance in making trading decisions. The following are the recommendations for the use of Bollinger Bands in an uptrend:
- If the price is in a strong uptrend, it will reach the upper band regularly, indicating that the stock is plunging higher, and traders can take advantage of the opportunity to make a buy decision. If the price fails to do that, it shows the uptrend may be losing momentum;
- Prices can drop for periods of time, even during uptrends. These are known as pullbacks. If the price pulls back during an uptrend but stays above the moving average (middle) line and moves back to the upper band, that implies a lot of strength;
- The price shouldn’t touch the lower band when it’s in a strong uptrend. If it does, that’s a possible indication of a reversal or that the stock is losing strength.
Day trading downtrends
Bollinger Bands also help determine how strongly a security is falling (downtrend) and when it’s potentially strengthening or reversing (to the upside). This data can then be used as guidance in making trading decisions. For example, the following are the recommendations for the use of Bollinger Bands in a downtrend:
- If the price is in a strong downtrend, it touches or moves along the lower the upper band regularly, indicating that the stock is plummeting, and traders can exploit the opportunity to sell. If the price fails to do that, it shows the downtrend may be losing momentum;
- Prices can rally for periods of time, even during a downtrend. These are known as pullbacks. When there are price pullbacks (highs), and the price stays below the moving average (middle) line and then moves down to the lower band, that implies selling strength;
- The price shouldn’t touch the upper band when it’s in a strong downtrend. If it does, that’s a possible indication that a trend is slowing or reversing.
Spotting trend reversals
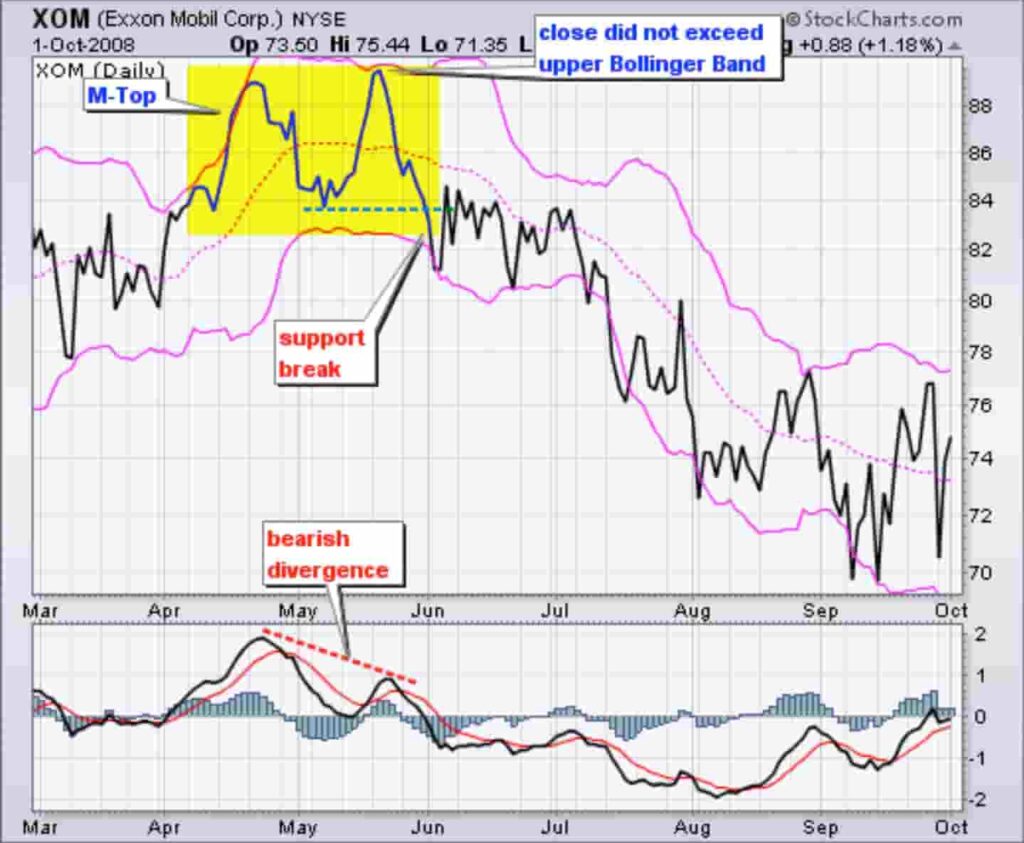
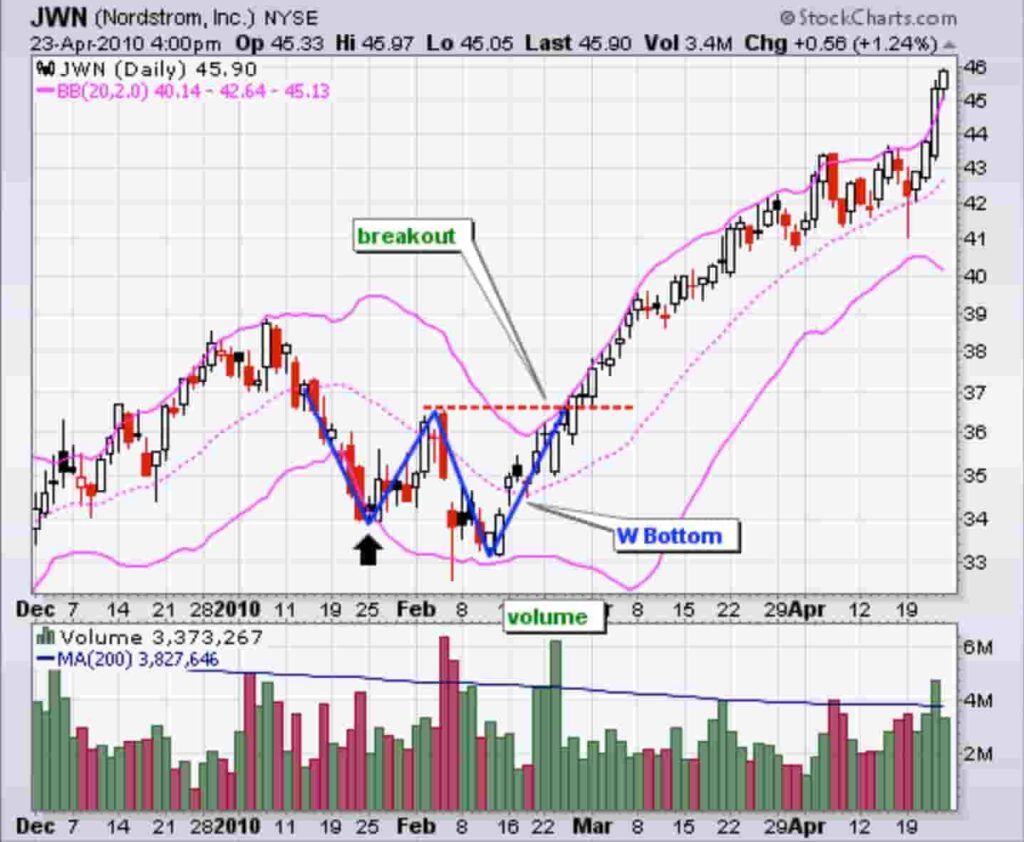
Double tops and double bottoms are essential technical analysis patterns used by traders. A double top has an M shape and signals a bearish price movement. A double bottom has a W shape and indicates a bullish reversal in trend.
M-top trend reversals
An M-top is a sell signal. It happens when price action spikes the upper line then recovers down, establishing the first high. Then after a while, another high is established, and this time it is below the upper band.
The second high must not be higher than the first one, and the second high mustn’t touch or spike the upper band.
W-bottom trend reversals
A W-bottom is a buy signal. It happens when price action spikes the lower line and then recovers, establishing the first low. Then after a while, another low is established, and this time it is above the lower band.
The second low must not be lower than the first one, and the second low mustn’t touch or spike the lower band. This bullish trading setup is confirmed when the price action moves and closes above the middle line (SMA).
Pros and cons of Bollinger Bands
As with most other technical analysis tools, Bollinger Bands, too, come with its own set of unique advantages and disadvantages. Therefore, it’s crucial to understand where this momentum indicator excels and where it fails to get the most out of its use.
Pros
- Works well in non-trending market conditions;
- Excellent tool for measuring volatility, which can easily be seen as the Bollinger Bands narrow or widen;
- Helpful at identifying new trends and the end of trends, making them a genuinely multi-purpose indicator;
- Useful at identifying overbought and oversold conditions;
- Useful at identifying significant movement on the market;
- Simple to apply and relatively straightforward;
- When automatically plotted by a trading platform, the bands are user-friendly and can add another dimension to chart analysis for traders.
Cons
- The bands will not be able to predict price patterns as a lagging indicator. Rather it follows recent market movements suggesting that traders may not get signals until the price movement is already underway;
- Bad at identifying cycle turns, giving a lot of false signals;
- Keep in mind that John Bollinger himself strongly alluded to Bollinger Bands be used in conjunction with other forms of technical analysis tools, as they don’t contain all of the data necessary for proper analysis of price action.
In conclusion
To sum up, Bollinger Bands are a valuable technical analysis tool. As a trend indicator, Bollinger bands are used to analyze volatility and dynamics of the price on the market – both beneficial when opening and closing trades quickly in a turbulent market.
Bollinger Bands can also assist in predicting trend reversals. However, traders should remember that Bollinger Bands are based on historical information. Therefore, the bands can only react to price movements but not predict future price movements.
Disclaimer: The content on this site should not be considered investment advice. Investing is speculative. When investing, your capital is at risk.
FAQs about Bollinger Bands
What are Bollinger Bands?
Bollinger Bands, developed by John Bollinger in the mid-1980s, are a popular technical analysis tool used by traders to analyze the markets. Bollinger Bands consists of three bands: the middle line (simple moving average), the upper line, and the lower line. The middle band essentially serves as a base for both the upper and lower.
How to interpret Bollinger Bands?
Bollinger Bands are a trend indicator that detect the volatility and dynamics of the price on the market. During periods of low volatility, the bands are narrow, while Bollinger Bands expand drastically during periods of high volatility. The consensus is that when the price reaches the upper band, it is considered as overbought, and when the price approaches the lower band, it is deemed to be oversold.
What are Bollinger Bands used for?
As Bollinger Bands offer unique insights into price and volatility, traders can find several uses for them, including determining overbought and oversold levels, as a trend-following tool, monitoring for breakouts, and deciding entry and exit points for a trade.
What are its limitations?
As a lagging indicator, it will not be able to predict price movements. Therefore, traders may not get signals until the price movement is already underway. Moreover, Bollinger Bands cannot be used as a standalone trading method. They are merely one indicator designed to provide traders with data regarding price volatility. John Bollinger suggests using them in conjunction with other non-correlated indicators that provide more direct market signals.
What is the difference between Keltner channel vs Bollinger bands?
Keltner Channels and Bollinger Bands are both used in market analysis but differ in their construction and interpretation. Keltner Channels are formed using an exponential moving average and the Average True Range to set the channel boundaries, focusing on trend direction and overbought/oversold conditions with smoother band movement. Bollinger Bands, on the other hand, use a simple moving average and standard deviation to determine their boundaries, making them more sensitive to market volatility and useful in identifying volatility, trends, and potential market extremes.
What is the difference between Donchian channels vs Bollinger bands?
Donchian channels and Bollinger bands are both technical analysis tools but differ in their construction and focus. Donchian channels are formed by taking the highest high and the lowest low over a set number of periods, highlighting price breakouts and extremes. Bollinger Bands, on the other hand, use a moving average with upper and lower bands set based on standard deviation, focusing on volatility and potential overbought or oversold market conditions.
What is the double Bollinger bands strategy in trading?
The Double Bollinger Bands Strategy uses two sets of Bollinger Bands, one with a standard deviation of 1 and another with 2, to analyze market trends and potential trade points. This strategy helps traders identify strong trends, periods of consolidation, and potential breakouts by observing price movements between these bands. It’s effective in spotting overbought or oversold market conditions.
What is the Bollinger bands day trading strategy?
The Bollinger Bands Day Trading Strategy involves using Bollinger Bands as a primary tool for short-term trading decisions within a single trading day. Traders observe how prices interact with the bands to make buy or sell decisions. For example, a price touching the lower band may suggest a buy opportunity, assuming oversold conditions, while touching the upper band might indicate a sell signal, suggesting overbought conditions. This strategy often incorporates other indicators for confirmation and is popular for its ability to adapt to different market volatility levels.
What are the best settings for Bollinger bands?
The best settings for Bollinger Bands typically depend on the specific market and trading style, but a common starting point is a 20-period moving average with a 2 standard deviation for the upper and lower bands. This setup is versatile, providing a balance between sensitivity and reliability for many markets and time frames. However, traders often adjust these parameters based on the volatility of the asset and their individual trading strategies.
What are the best Bollinger bands settings for scalping?
For scalping, a common Bollinger bands setting is a shorter period moving average, like 5 or 10 periods, with a 2 standard deviation for the upper and lower bands. This configuration provides a more responsive indicator suited for the fast-paced nature of scalping, allowing traders to identify quick market movements and potential entry or exit points. However, these settings should be adjusted according to the specific market and the trader’s personal strategy.
What is the best indicator to use with Bollinger Bands?
The best indicator to use with Bollinger Bands is the Relative Strength Index (RSI). It helps confirm overbought or oversold conditions when prices touch the bands, adding more reliability to potential trade signals.
What is the Bollinger bands and RSI strategy?
This strategy typically involves looking for price movements that touch or breach the Bollinger Bands and confirming these signals with the RSI. For instance, a price touching the lower Bollinger Band while the RSI is below 30 may indicate an oversold condition, suggesting a potential buy opportunity. Conversely, a price at the upper Bollinger Band with an RSI above 70 might signal an overbought condition, indicating a potential sell. This combined approach helps filter out false signals and enhances the reliability of trade setups.
What are tight Bollinger bands?
Tight Bollinger bands occur when the upper and lower bands come close together, indicating low market volatility. This often precedes significant price movements, as markets tend to alternate between periods of low and high volatility. Traders watch for a breakout from tight Bollinger Bands as a potential signal for entering trades, with the direction of the breakout suggesting the trade direction.
How do you identify a Bollinger Band squeeze?
A Bollinger Band squeeze is identified when the bands narrow significantly, indicating low volatility and a potential upcoming breakout.
Best Crypto Exchange for Intermediate Traders and Investors
-
Invest in cryptocurrencies and 3,000+ other assets including stocks and precious metals.
-
0% commission on stocks - buy in bulk or just a fraction from as little as $10. Other fees apply. For more information, visit etoro.com/trading/fees.
-
Copy top-performing traders in real time, automatically.
-
eToro USA is registered with FINRA for securities trading.